
Compare Pricol Ltd with Similar Stocks
Dashboard
High Management Efficiency with a high ROE of 15.65%
Strong ability to service debt as the company has a low Debt to EBITDA ratio of 0.81 times
Healthy long term growth as Operating profit has grown by an annual rate 33.32%
With a growth in Net Profit of 109.53%, the company declared Outstanding results in Mar 26
High Institutional Holdings at 28.04%
Market Beating performance in long term as well as near term
Stock DNA
Auto Components & Equipments
INR 7,095 Cr (Small Cap)
28.00
24
0.35%
0.20
19.99%
5.58
Total Returns (Price + Dividend) 
Latest dividend: 1.9977913693510025 per share ex-dividend date: Nov-14-2025
Risk Adjusted Returns v/s
Returns Beta

News

Pricol Ltd is Rated Buy by MarketsMOJO
Pricol Ltd is rated 'Buy' by MarketsMOJO, with this rating last updated on 01 June 2026. However, all fundamentals, returns, and financial metrics discussed here reflect the company’s current position as of 23 June 2026, providing investors with the latest insights into the stock’s performance and outlook.
Read full news article
Pricol Ltd Valuation Shifts Signal Changing Price Attractiveness in Auto Components Sector
Pricol Ltd, a key player in the Auto Components & Equipments sector, has seen its valuation parameters shift notably, moving from an expensive to a very expensive rating. Despite this, the company continues to demonstrate robust fundamentals, with strong returns on capital and equity, positioning it as a compelling albeit pricier investment option in the small-cap segment.
Read full news article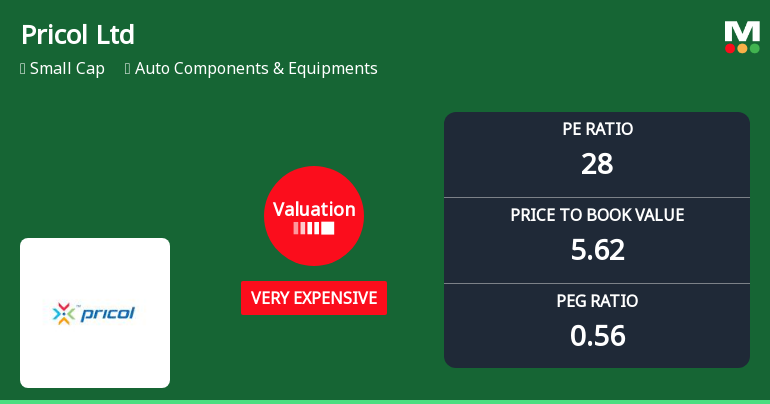
Pricol Ltd Valuation Shifts Signal Changing Price Attractiveness Amid Sector Dynamics
Pricol Ltd, a key player in the Auto Components & Equipments sector, has seen its valuation metrics shift notably, moving from an expensive to a very expensive rating. Despite this, the stock has demonstrated robust market performance over the past year and longer horizons, prompting a nuanced analysis of its price attractiveness relative to historical and peer benchmarks.
Read full news article Announcements
Announcement under Regulation 30 (LODR)-Newspaper Publication
16-Jun-2026 | Source : BSECopy of Newspaper advertisement to shareholders for the re-lodgement of transfer requests for physical shares and 100 days campaign - Saksham Niveshak
Announcement under Regulation 30 (LODR)-Newspaper Publication
26-May-2026 | Source : BSECopy of Newspaper advertisement published by the company relating to loss of share certificate
Compliances-Reg.24(A)-Annual Secretarial Compliance
22-May-2026 | Source : BSEAnnual Secretarial Compliance Report for the financial year ended 31st March 2026
Corporate Actions

No Upcoming Board Meetings

Pricol Ltd has declared 200% dividend, ex-date: 14 Nov 25

No Splits history available

No Bonus history available

Pricol Ltd has announced 2:7 rights issue, ex-date: 24 Nov 20
Quality key factors
Valuation key factors
Technicals key factors
 Technical Indicator Scale: Bearish, Mildly Bearish, Sideways, Mildly Bullish, Bullish Turned
 Shareholding Snapshot : Mar 2026
Shareholding Compare (%holding)
Promoters
None
Held by 14 Schemes (10.25%)
Held by 121 FIIs (15.61%)
Pricol Holdings Private Limited (9.03%)
Goldman Sachs Funds - Goldman Sachs India Equity Portfolio (4.2%)
27.46%
Quarterly Results Snapshot (Consolidated) - Mar'26 - YoY

YoY Growth in quarter ended Mar 2026 is 42.87% vs 31.70% in Mar 2025
YoY Growth in quarter ended Mar 2026 is 109.53% vs -15.78% in Mar 2025
Half Yearly Results Snapshot (Consolidated) - Sep'25
Growth in half year ended Sep 2025 is 47.60% vs 15.58% in Sep 2024

Growth in half year ended Sep 2025 is 25.65% vs 39.24% in Sep 2024
Nine Monthly Results Snapshot (Consolidated) - Dec'25
YoY Growth in nine months ended Dec 2025 is 53.00% vs 13.92% in Dec 2024
YoY Growth in nine months ended Dec 2025 is 34.44% vs 33.27% in Dec 2024
Annual Results Snapshot (Consolidated) - Mar'26
YoY Growth in year ended Mar 2026 is 50.11% vs 18.49% in Mar 2025
YoY Growth in year ended Mar 2026 is 50.15% vs 18.79% in Mar 2025
About Pricol Ltd

Company Coordinates


