
Compare PSP Projects with Similar Stocks
Stock DNA
Construction
INR 3,853 Cr (Small Cap)
53.00
36
0.00%
-0.07
4.39%
2.98
Total Returns (Price + Dividend) 
Latest dividend: 2.5155298603850174 per share ex-dividend date: Sep-01-2023
Risk Adjusted Returns v/s
Returns Beta

News
Are PSP Projects Ltd latest results good or bad?
PSP Projects Ltd's latest financial results for Q1 FY27 reveal a significant year-on-year growth in both revenue and net profit, showcasing a recovery from the previous year's low performance. The company reported a net profit of ₹18.34 crores, reflecting a remarkable year-on-year increase of 4,266.67% compared to just ₹0.42 crores in Q1 FY26. Revenue also saw a substantial rise, reaching ₹853.47 crores, which is a 64.84% increase from the same quarter last year. However, the results also indicate a sequential decline in both revenue and profitability. Compared to the previous quarter (Q4 FY26), revenue decreased by 23.47%, and net profit fell by 13.04%. This decline raises concerns about the sustainability of the company's growth momentum and its ability to maintain profitability in the near term. The operating margin improved to 6.42% from 4.79% year-on-year, yet it contracted from 5.36% in the previous...
Read full news article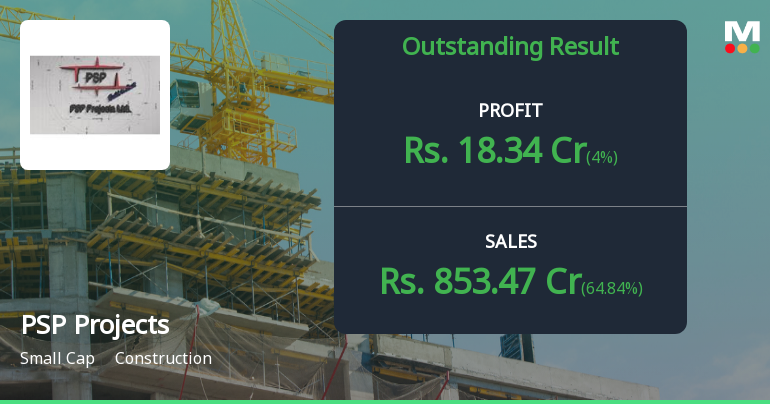
PSP Projects Q1 FY27: Strong Revenue Growth Masks Margin Pressure and Valuation Concerns
PSP Projects Ltd., the Ahmedabad-based construction company, delivered a remarkable 64.84% year-on-year revenue surge in Q1 FY27, posting net sales of ₹853.47 crores. However, the euphoria was short-lived as the stock plummeted 7.09% on July 30, 2026, closing at ₹950.75, reflecting investor concerns over sequential profit decline and elevated valuation multiples. With a market capitalisation of ₹3,984 crores, the company's consolidated net profit stood at ₹18.34 crores in Q1 FY27, representing a staggering 4,266.67% year-on-year improvement but a concerning 13.04% decline from the previous quarter's ₹21.09 crores.
Read full news article
Announcements
Announcement under Regulation 30 (LODR)-Newspaper Publication
21-Jul-2026 | Source : BSESubmission of Newspaper Publication for transfer of shares to IEPF
Disclosure Under Regulation 30 Of The SEBI (Listing Obligations And Disclosure Requirements) Regulations 2015 (SEBI Listing Regulations) - ESG Rating
11-Jul-2026 | Source : BSEIntimation of ESG Ratings
Announcement under Regulation 30 (LODR)-Analyst / Investor Meet - Intimation
09-Jul-2026 | Source : BSEIntimation of Q1FY27 Earnings Conference Call
Corporate Actions

No Upcoming Board Meetings

PSP Projects Ltd has declared 25% dividend, ex-date: 01 Sep 23

No Splits history available

No Bonus history available

No Rights history available
Quality key factors
Valuation key factors
Technicals key factors
 Technical Indicator Scale: Bearish, Mildly Bearish, Sideways, Mildly Bullish, Bullish Turned
 Shareholding Snapshot : Jun 2026
Shareholding Compare (%holding)
Promoters
None
Held by 5 Schemes (2.53%)
Held by 43 FIIs (2.1%)
Adani Infra (india) Limited (34.41%)
Madhulika Agarwal (2.27%)
17.06%
Quarterly Results Snapshot (Consolidated) - Jun'26 - YoY

YoY Growth in quarter ended Jun 2026 is 64.84% vs -16.90% in Jun 2025
YoY Growth in quarter ended Jun 2026 is 4,266.67% vs -98.79% in Jun 2025
Half Yearly Results Snapshot (Consolidated) - Sep'25

Growth in half year ended Sep 2025 is 0.96% vs 6.68% in Sep 2024
Growth in half year ended Sep 2025 is -63.05% vs -41.21% in Sep 2024
Nine Monthly Results Snapshot (Consolidated) - Dec'25
YoY Growth in nine months ended Dec 2025 is 10.56% vs 0.07% in Dec 2024
YoY Growth in nine months ended Dec 2025 is -31.09% vs -53.51% in Dec 2024
Annual Results Snapshot (Consolidated) - Mar'26
YoY Growth in year ended Mar 2026 is 25.34% vs 0.25% in Mar 2025
YoY Growth in year ended Mar 2026 is -1.60% vs -54.12% in Mar 2025
About PSP Projects Ltd

Company Coordinates


