
Compare Dixon Technolog. with Similar Stocks
Dashboard
Strong Long Term Fundamental Strength with an average Return on Capital Employed (ROCE) of 29.78%
- Healthy long term growth as Net Sales has grown by an annual rate of 49.94% and Operating profit at 43.41%
- Strong ability to service debt as the company has a low Debt to EBITDA ratio of 0.53 times
The company has declared Positive results for the last 14 consecutive quarters
High Institutional Holdings at 46.26%
With its market cap of Rs 87,660 cr, it is the biggest company in the sector and constitutes 50.63% of the entire sector
Stock DNA
Electronics & Appliances
INR 87,846 Cr (Mid Cap)
60.00
61
0.06%
-0.05
30.76%
18.74
Total Returns (Price + Dividend) 
Latest dividend: 8 per share ex-dividend date: Sep-16-2025
Risk Adjusted Returns v/s
Returns Beta

News
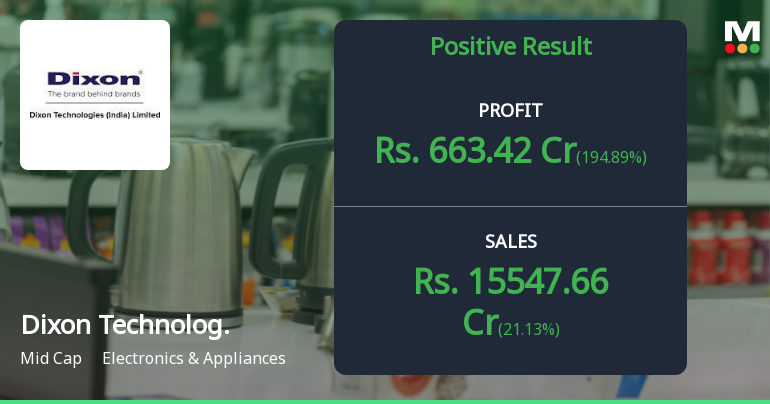
Dixon Technologies Q1 FY27: Stellar 195% Profit Surge Masks Margin Pressure Concerns
Dixon Technologies (India) Ltd., India's leading contract electronics manufacturer, delivered an extraordinary first-quarter performance for FY2027, with consolidated net profit surging 194.89% year-on-year to ₹663.42 crores in Q1 FY27 ended June 2026. The ₹87,846-crore market capitalisation company reported a sequential profit jump of 158.73% from ₹256.41 crores in Q4 FY26, driven by exceptional other income and robust revenue growth. However, the stock retreated 1.68% following the results announcement, closing at ₹14,096.30 on July 31, 2026, as investors digested underlying margin compression concerns despite the headline profit beat.
Read full news article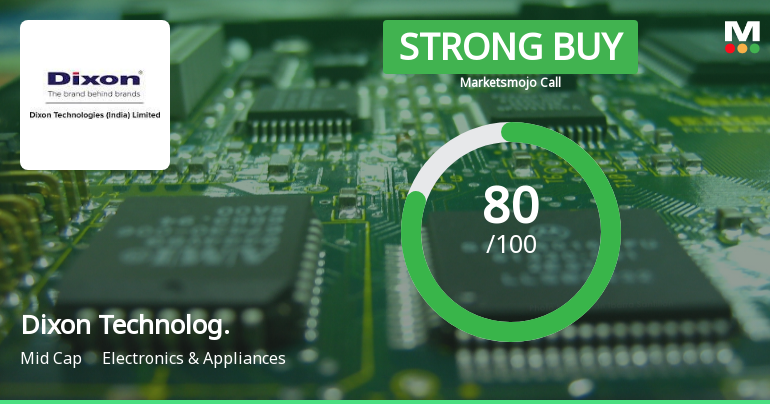
Dixon Technologies Upgraded to Strong Buy on Robust Fundamentals and Bullish Technicals
Dixon Technologies (India) Ltd has seen its investment rating upgraded from Hold to Strong Buy, reflecting significant improvements across quality, valuation, financial trends, and technical indicators. This upgrade, announced on 29 July 2026, follows a comprehensive reassessment of the company’s fundamentals and market positioning, signalling renewed investor confidence in the mid-cap electronics and appliances player.
Read full news article
Dixon Technologies (India) Ltd: Technical Momentum Shifts Signal Bullish Outlook
Dixon Technologies (India) Ltd has demonstrated a notable shift in price momentum, transitioning from a sideways trend to a bullish stance, supported by a series of positive technical indicator signals. The stock’s recent performance, combined with upgraded technical ratings and a strong MarketsMOJO grade, positions it favourably within the Electronics & Appliances sector.
Read full news article Announcements
Board Meeting Intimation for Consideration And Approval Of Unaudited Financial Results For The Quarter Ended 30Th June 2026
24-Jul-2026 | Source : BSEDixon Technologies (India) Ltdhas informed BSE that the meeting of the Board of Directors of the Company is scheduled on 31/07/2026 inter alia to consider and approve unaudited financial results (standalone and consolidated) of the Company for the quarter ended 30th June 2026
Announcement under Regulation 30 (LODR)-Analyst / Investor Meet - Intimation
24-Jul-2026 | Source : BSEWe wish to inform you that the Company has arranged a Conference Call for the Un-Audited Financial Results (Standalone and Consolidated) of the Company for the Quarter ended as on 30th June 2026 on Friday 31st July 2026 at 16:30 Hrs. (IST).
Compliances-Certificate under Reg. 74 (5) of SEBI (DP) Regulations 2018
15-Jul-2026 | Source : BSECompliance- Certificate under Regulation 74(5) of SEBI (DP) Regulations 2018 for the quarter ended 30th June 2026
Corporate Actions

No Upcoming Board Meetings

Dixon Technologies (India) Ltd has declared 400% dividend, ex-date: 16 Sep 25

Dixon Technologies (India) Ltd has announced 2:10 stock split, ex-date: 18 Mar 21

No Bonus history available

No Rights history available
Quality key factors
Valuation key factors
Technicals key factors
 Technical Indicator Scale: Bearish, Mildly Bearish, Sideways, Mildly Bullish, Bullish Turned
 Shareholding Snapshot : Jun 2026
Shareholding Compare (%holding)
Promoters
None
Held by 43 Schemes (20.05%)
Held by 623 FIIs (17.87%)
Psv Family Trust Under The Trustees Mr. Sunil Vachani And Mrs. Gayatri Vachani (15.47%)
Kamla Vachani (6.19%)
13.49%
Quarterly Results Snapshot (Consolidated) - Jun'26 - YoY

YoY Growth in quarter ended Jun 2026 is 21.13% vs 95.08% in Jun 2025

YoY Growth in quarter ended Jun 2026 is 194.89% vs 68.29% in Jun 2025
Half Yearly Results Snapshot (Consolidated) - Sep'25
Growth in half year ended Sep 2025 is 52.87% vs 120.51% in Sep 2024
Growth in half year ended Sep 2025 is 70.95% vs 197.22% in Sep 2024
Nine Monthly Results Snapshot (Consolidated) - Dec'25
YoY Growth in nine months ended Dec 2025 is 34.29% vs 119.20% in Dec 2024
YoY Growth in nine months ended Dec 2025 is 70.17% vs 154.87% in Dec 2024
Annual Results Snapshot (Consolidated) - Mar'26
YoY Growth in year ended Mar 2026 is 25.77% vs 119.66% in Mar 2025
YoY Growth in year ended Mar 2026 is 31.32% vs 197.90% in Mar 2025
About Dixon Technologies (India) Ltd

Company Coordinates


