
Compare Dixon Technolog. with Similar Stocks
Dashboard
Strong Long Term Fundamental Strength with an average Return on Capital Employed (ROCE) of 29.78%
- Healthy long term growth as Net Sales has grown by an annual rate of 49.94% and Operating profit at 43.41%
- Strong ability to service debt as the company has a low Debt to EBITDA ratio of 0.53 times
The company has declared Positive results for the last 13 consecutive quarters
With ROE of 30.8, it has a Fair valuation with a 16.1 Price to Book Value
High Institutional Holdings at 46.44%
Underperformed the market in the last 1 year
Stock DNA
Electronics & Appliances
INR 73,260 Cr (Mid Cap)
52.00
58
0.06%
-0.05
30.76%
16.11
Total Returns (Price + Dividend) 
Latest dividend: 8 per share ex-dividend date: Sep-16-2025
Risk Adjusted Returns v/s
Returns Beta

News
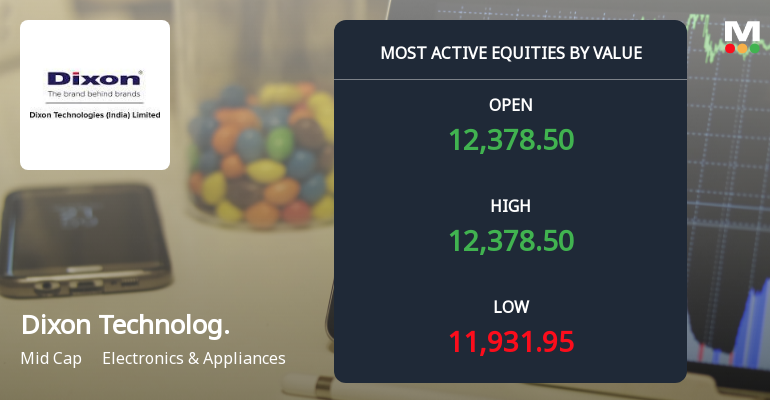
Dixon Technologies Sees High-Value Trading Amidst Four-Day Decline
Dixon Technologies (India) Ltd, a mid-cap player in the Electronics & Appliances sector, witnessed significant trading activity on 23 June 2026, with a total traded value exceeding ₹414 crores. Despite this high-value turnover, the stock has been under pressure, declining for four consecutive sessions and underperforming its sector and the broader market.
Read full news article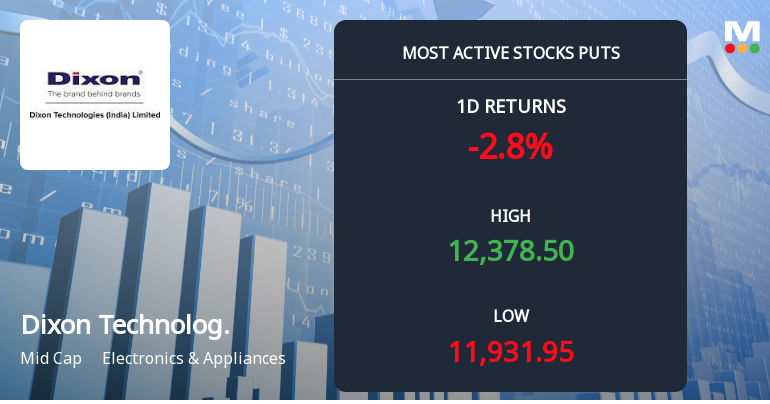
Rs 12,000 Puts — 0.5% Above Current Price — Draw 6,974 Contracts on Dixon Technologies (India) Ltd
The stock is trading just below the Rs 12,000 put strike at Rs 11,942, with nearly 7,000 contracts changing hands on 23 Jun 2026. This activity raises the question: is this a bearish bet, protective hedging, or put writing? The full data set for Dixon Technologies (India) Ltd offers clues to the options market’s intent.
Read full news article
11,398 Call Contracts Traded on Dixon Technologies as Stock Declines Amid Mixed Signals
11,398 call contracts at the Rs 13,000 strike were exchanged on Dixon Technologies (India) Ltd on 23 Jun 2026, while the stock closed at Rs 11,945, down 2.84%% on the day. This divergence between heavy call activity and a falling share price highlights a complex interplay between derivatives positioning and cash market sentiment.
Read full news article Announcements
Clarification sought from Dixon Technologies (India) Ltd
17-Jun-2026 | Source : BSEThe Exchange has sought clarification from Dixon Technologies (India) Ltd on June 17 2026 with reference to news appeared in https://www.moneycontrol.com dated June 17 2026 quoting Dixon Tech shares rise 5% amid buzz of govt nod for Vivo JV; JPMorgan retains ˜overweight rating
The reply is awaited.
Clarification/Confirmation On News Item Appearing In Https://Www.Moneycontrol.Com
17-Jun-2026 | Source : BSEClarification/ Confirmation on news item appearing in https://www.moneycontrol.com
Announcement Under Regulation 30 Of SEBI LODR- Execution Of Binding Term Sheet In Relation To A Proposed Joint Venture Arrangement
09-Jun-2026 | Source : BSEAnnouncement under Regulation 30 of SEBI LODR- Execution of binding term sheet amongst Dixon Technologies (India) Limited Gemtek Technology Co. Ltd. and Dixon Electroconnect Private Limited for setting up of a joint venture arrangement
Corporate Actions

No Upcoming Board Meetings

Dixon Technologies (India) Ltd has declared 400% dividend, ex-date: 16 Sep 25

Dixon Technologies (India) Ltd has announced 2:10 stock split, ex-date: 18 Mar 21

No Bonus history available

No Rights history available
Quality key factors
Valuation key factors
Technicals key factors
 Technical Indicator Scale: Bearish, Mildly Bearish, Sideways, Mildly Bullish, Bullish Turned
 Shareholding Snapshot : Mar 2026
Shareholding Compare (%holding)
Promoters
None
Held by 41 Schemes (19.26%)
Held by 641 FIIs (18.29%)
Psv Family Trust Under The Trustees Mr. Sunil Vachani And Mrs. Gayatri Vachani (15.54%)
Kamla Vachani (6.25%)
13.19%
Quarterly Results Snapshot (Consolidated) - Mar'26 - YoY

YoY Growth in quarter ended Mar 2026 is 2.12% vs 120.97% in Mar 2025
YoY Growth in quarter ended Mar 2026 is -36.03% vs 321.16% in Mar 2025
Half Yearly Results Snapshot (Consolidated) - Sep'25
Growth in half year ended Sep 2025 is 52.87% vs 120.51% in Sep 2024
Growth in half year ended Sep 2025 is 70.95% vs 197.22% in Sep 2024
Nine Monthly Results Snapshot (Consolidated) - Dec'25
YoY Growth in nine months ended Dec 2025 is 34.29% vs 119.20% in Dec 2024
YoY Growth in nine months ended Dec 2025 is 70.17% vs 154.87% in Dec 2024
Annual Results Snapshot (Consolidated) - Mar'26
YoY Growth in year ended Mar 2026 is 25.77% vs 119.66% in Mar 2025
YoY Growth in year ended Mar 2026 is 31.32% vs 197.90% in Mar 2025
About Dixon Technologies (India) Ltd

Company Coordinates


