
Compare Shree Ganesh Rem with Similar Stocks
Dashboard
Company has a Debt to Equity ratio (avg) of 0.05 times
Poor long term growth as Operating profit has grown by an annual rate 16.32% of over the last 5 years
Flat results in Mar 26
With ROE of 10.9, it has a Very Expensive valuation with a 5.5 Price to Book Value
Despite the size of the company, domestic mutual funds hold only 0% of the company
Market Beating performance in long term as well as near term
Stock DNA
Pharmaceuticals & Biotechnology
INR 836 Cr (Micro Cap)
51.00
34
0.00%
0.03
10.90%
4.61
Total Returns (Price + Dividend) 
Latest dividend: 0.5 per share ex-dividend date: Sep-07-2023
Risk Adjusted Returns v/s
Returns Beta

News
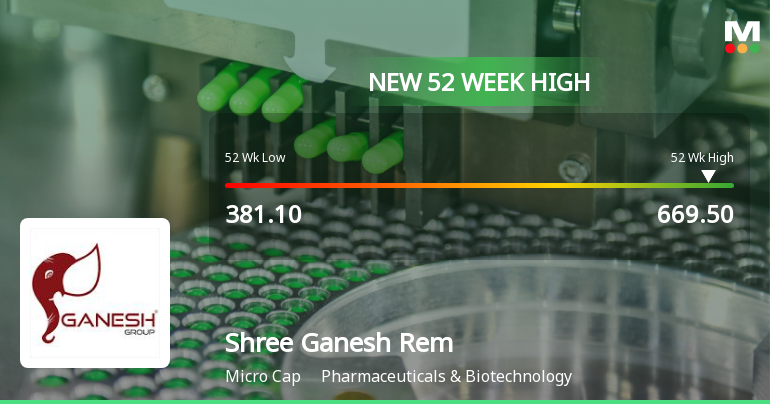
Broad-Based Technical Strength Lifts Shree Ganesh Remedies Ltd to 52-Week High of Rs 669.5
With a decisive surge to Rs 669.5 on 19 Jun 2026, Shree Ganesh Remedies Ltd has reached a fresh 52-week high, marking a significant milestone in its price momentum. This rally comes amid a backdrop of strong technical signals and sustained upward movement across multiple timeframes.
Read full news article
Shree Ganesh Remedies Ltd is Rated Hold
Shree Ganesh Remedies Ltd is rated 'Hold' by MarketsMOJO, with this rating last updated on 20 May 2026. However, the analysis and financial metrics discussed here reflect the stock's current position as of 12 June 2026, providing investors with an up-to-date view of the company’s fundamentals, valuation, financial trends, and technical outlook.
Read full news article
Shree Ganesh Remedies Ltd Technical Momentum Shifts Amid Mixed Market Signals
Shree Ganesh Remedies Ltd, a micro-cap player in the Pharmaceuticals & Biotechnology sector, has experienced a notable shift in its technical momentum, moving from a bullish to a mildly bullish stance. Despite a recent day decline of 4.81%, the stock’s technical indicators present a complex picture, with mixed signals across weekly and monthly timeframes. This article analyses the evolving price momentum, key technical indicators such as MACD, RSI, moving averages, and their implications for investors.
Read full news article Announcements
Compliances-Reg.24(A)-Annual Secretarial Compliance
25-May-2026 | Source : BSEAnnual Secretarial Compliance Report for the year ended March 31 2026
Announcement under Regulation 30 (LODR)-Earnings Call Transcript
20-May-2026 | Source : BSETranscript of Earnings Call
Announcement under Regulation 30 (LODR)-Analyst / Investor Meet - Outcome
16-May-2026 | Source : BSEAudio Recording - Earnings Call held on May 15 2026
Corporate Actions

No Upcoming Board Meetings

Shree Ganesh Remedies Ltd has declared 5% dividend, ex-date: 07 Sep 23

No Splits history available

Shree Ganesh Remedies Ltd has announced 1:5 bonus issue, ex-date: 01 Nov 21

Shree Ganesh Remedies Ltd has announced 7:100 rights issue, ex-date: 03 Feb 23
Quality key factors
Valuation key factors
Technicals key factors
 Technical Indicator Scale: Bearish, Mildly Bearish, Sideways, Mildly Bullish, Bullish Turned
 Shareholding Snapshot : Mar 2026
Shareholding Compare (%holding)
Promoters
None
Held by 2 Schemes (0.0%)
Held by 0 FIIs
Chandulal Manubhai Kothia (48.76%)
Gunjan Jayantibhai Dhorajiya (1.7%)
24.97%
Quarterly Results Snapshot (Consolidated) - Mar'26 - YoY

YoY Growth in quarter ended Mar 2026 is 35.90% vs -34.56% in Mar 2025
YoY Growth in quarter ended Mar 2026 is -4.86% vs -47.66% in Mar 2025
Half Yearly Results Snapshot (Consolidated) - Sep'25
Not Applicable: The company has declared_date for only one period
Not Applicable: The company has declared_date for only one period
Nine Monthly Results Snapshot (Consolidated) - Dec'25

YoY Growth in nine months ended Dec 2025 is -9.59% vs 65.90% in Dec 2024
YoY Growth in nine months ended Dec 2025 is -30.24% vs 72.28% in Dec 2024
Annual Results Snapshot (Consolidated) - Mar'26
YoY Growth in year ended Mar 2026 is 0.64% vs -13.74% in Mar 2025
YoY Growth in year ended Mar 2026 is -23.02% vs -17.93% in Mar 2025
About Shree Ganesh Remedies Ltd

Company Coordinates


