
Compare H.G. Infra Engg. with Similar Stocks
Dashboard
The company has declared negative results for the last 7 consecutive quarters
- PBT LESS OI(Q) At Rs 53.34 cr has Fallen at -59.39%
- PAT(Q) At Rs 46.84 cr has Fallen at -64.2%
- INTEREST(Latest six months) At Rs 265.98 cr has Grown at 31.26%
Falling Participation by Institutional Investors
Underperformed the market in the last 1 year
Stock DNA
Construction
INR 3,744 Cr (Small Cap)
13.00
37
0.35%
1.46
8.95%
1.15
Total Returns (Price + Dividend) 
Latest dividend: 2.0048634682608033 per share ex-dividend date: Aug-12-2025
Risk Adjusted Returns v/s
Returns Beta

News
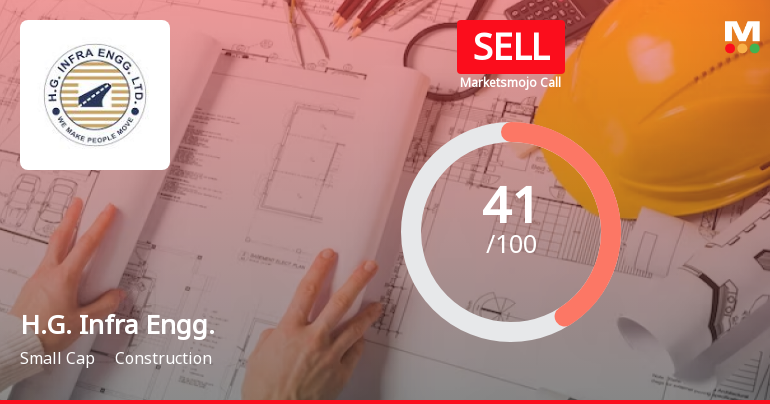
H.G. Infra Engineering Ltd is Rated Sell
H.G. Infra Engineering Ltd is rated 'Sell' by MarketsMOJO, with this rating last updated on 22 May 2025. However, the analysis and financial metrics discussed here reflect the company’s current position as of 14 June 2026, providing investors with an up-to-date view of its fundamentals, returns, and market standing.
Read full news article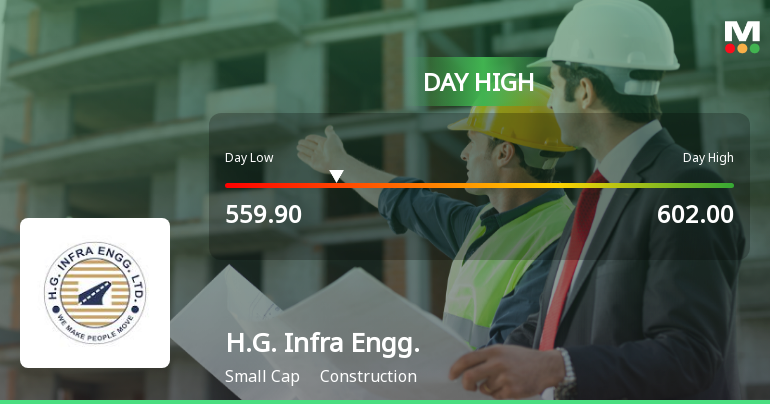
H.G. Infra Engineering Ltd Surges 9.1% to Day's High of Rs 597.7 — Outperforms Sector by 9.26 Percentage Points
The Sensex declined nearly 1% on 8 Jun 2026, yet H.G. Infra Engineering Ltd surged 9.1% to an intraday high of Rs 597.7, outperforming its construction sector peers by over 9 percentage points. This sharp single-session gain rewrites the short-term narrative for the stock, which had been under pressure in recent days.
Read full news article
H.G. Infra Engineering Ltd is Rated Sell
H.G. Infra Engineering Ltd is rated 'Sell' by MarketsMOJO, with this rating last updated on 22 May 2025. However, the analysis and financial metrics discussed here reflect the company's current position as of 03 June 2026, providing investors with an up-to-date view of the stock's fundamentals, returns, and technical outlook.
Read full news article Announcements
Announcement under Regulation 30 (LODR)-Change in Management
18-Jun-2026 | Source : BSEChange in Key Managerial Personnel/Senior Management Personnel
Announcement under Regulation 30 (LODR)-Newspaper Publication
18-Jun-2026 | Source : BSENewspaper publication pertaining to submission of Notice to Equity Shareholders of the Company regarding transfer of Equity Shares to Investor Education and Protection Fund (IEPF) Account
Receipt Of Letter Of Intent From REC Power Development And Consultancy Limited
13-Jun-2026 | Source : BSEReceipt of Letter of Intent from REC Power Development and Consultancy Limited
Corporate Actions

No Upcoming Board Meetings

H.G. Infra Engineering Ltd has declared 20% dividend, ex-date: 12 Aug 25

No Splits history available

No Bonus history available

No Rights history available
Quality key factors
Valuation key factors
Technicals key factors
 Technical Indicator Scale: Bearish, Mildly Bearish, Sideways, Mildly Bullish, Bullish Turned
 Shareholding Snapshot : Mar 2026
Shareholding Compare (%holding)
Promoters
None
Held by 11 Schemes (9.14%)
Held by 51 FIIs (1.39%)
Vijendra Singh Family Trust (23.95%)
Nippon Life India Trustee Ltd-a/c Nippon India Small Cap Fund (3.4%)
13.86%
Quarterly Results Snapshot (Consolidated) - Mar'26 - YoY

YoY Growth in quarter ended Mar 2026 is 4.84% vs -20.33% in Mar 2025

YoY Growth in quarter ended Mar 2026 is -42.11% vs -22.65% in Mar 2025
Half Yearly Results Snapshot (Consolidated) - Sep'25
Growth in half year ended Sep 2025 is -1.80% vs 5.41% in Sep 2024
Growth in half year ended Sep 2025 is -37.94% vs -1.30% in Sep 2024
Nine Monthly Results Snapshot (Consolidated) - Dec'25
YoY Growth in nine months ended Dec 2025 is 3.05% vs 0.68% in Dec 2024
YoY Growth in nine months ended Dec 2025 is -31.58% vs 2.85% in Dec 2024
Annual Results Snapshot (Consolidated) - Mar'26
YoY Growth in year ended Mar 2026 is 3.53% vs -5.99% in Mar 2025
YoY Growth in year ended Mar 2026 is -34.64% vs -6.15% in Mar 2025
About H.G. Infra Engineering Ltd

Company Coordinates


