
Compare H.G. Infra Engg. with Similar Stocks
Dashboard
The company has declared negative results for the last 7 consecutive quarters
- PAT(Latest six months) At Rs 141.12 cr has Grown at -42.66%
- INTEREST(Latest six months) At Rs 265.98 cr has Grown at 31.26%
- OPERATING PROFIT TO INTEREST (Q) Lowest at 1.74 times
Falling Participation by Institutional Investors
Below par performance in long term as well as near term
Stock DNA
Construction
INR 3,519 Cr (Small Cap)
12.00
35
0.37%
1.46
8.95%
1.07
Total Returns (Price + Dividend) 
Latest dividend: 2.0048634682608033 per share ex-dividend date: Aug-12-2025
Risk Adjusted Returns v/s
Returns Beta

News

H.G. Infra Engineering Ltd is Rated Sell
H.G. Infra Engineering Ltd is rated 'Sell' by MarketsMOJO, with this rating last updated on 22 May 2025. However, the analysis and financial metrics discussed here reflect the stock's current position as of 28 July 2026, providing investors with an up-to-date view of the company’s fundamentals, returns, and market performance.
Read full news article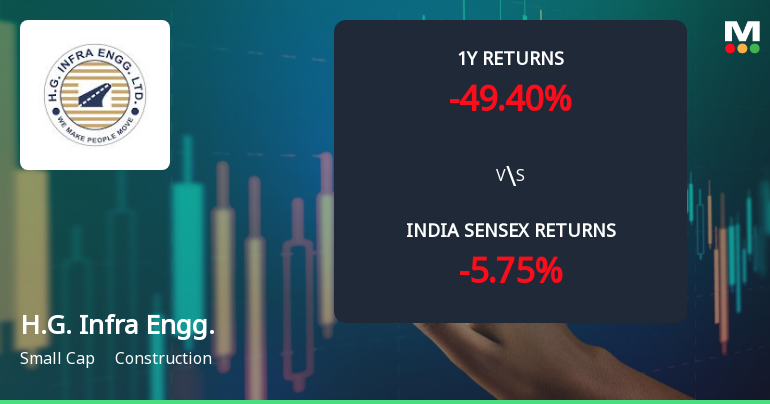
H.G. Infra Engineering Ltd Faces Bearish Momentum Amid Technical Downgrade
H.G. Infra Engineering Ltd has experienced a notable shift in its technical momentum, with key indicators signalling a bearish trend. The stock, currently priced at ₹552.50, has seen a decline of 1.37% today, reflecting growing investor caution amid deteriorating technical signals and a challenging market backdrop.
Read full news article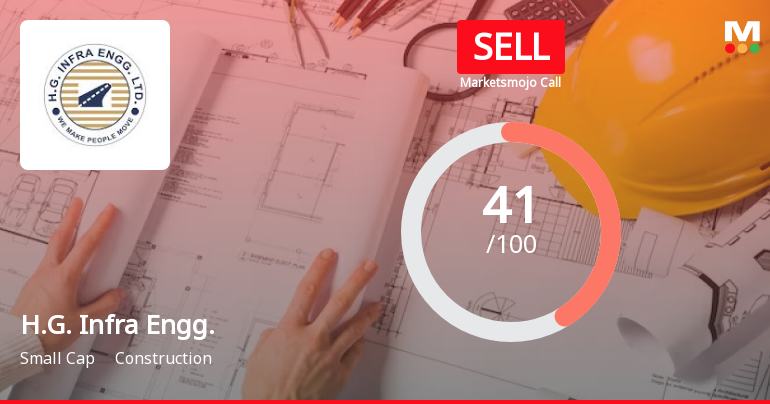
H.G. Infra Engineering Ltd is Rated Sell
H.G. Infra Engineering Ltd is rated 'Sell' by MarketsMOJO, with this rating last updated on 22 May 2025. However, the analysis and financial metrics discussed here reflect the stock's current position as of 17 July 2026, providing investors with an up-to-date view of the company’s fundamentals, returns, and market performance.
Read full news article Announcements
Announcement under Regulation 30 (LODR)-Restructuring
23-Jul-2026 | Source : BSEIntimation under Regulations 30 and 51 of the SEBI (Listing Obligations and Disclosure Requirements) Regulations 2015
Announcement under Regulation 30 (LODR)-Newspaper Publication
21-Jul-2026 | Source : BSENewspaper Advertisement - Information regarding 24th Annual General Meeting
Announcement under Regulation 30 (LODR)-Award_of_Order_Receipt_of_Order
13-Jul-2026 | Source : BSEH.G. Infra Engineering Limited has been declared as L-1 bidder by the Department of Skill Employment & Entrepreneurship Government of Rajasthan
Corporate Actions

No Upcoming Board Meetings

H.G. Infra Engineering Ltd has declared 20% dividend, ex-date: 12 Aug 26

No Splits history available

No Bonus history available

No Rights history available
Quality key factors
Valuation key factors
Technicals key factors
 Technical Indicator Scale: Bearish, Mildly Bearish, Sideways, Mildly Bullish, Bullish Turned
 Shareholding Snapshot : Jun 2026
Shareholding Compare (%holding)
Promoters
None
Held by 11 Schemes (8.6%)
Held by 43 FIIs (1.38%)
Vijendra Singh Family Trust (23.95%)
Nippon Life India Trustee Ltd-a/c Nippon India Small Cap Fund (3.4%)
14.42%
Quarterly Results Snapshot (Consolidated) - Mar'26 - YoY

YoY Growth in quarter ended Mar 2026 is 4.84% vs -20.33% in Mar 2025

YoY Growth in quarter ended Mar 2026 is -42.11% vs -22.65% in Mar 2025
Half Yearly Results Snapshot (Consolidated) - Sep'25
Growth in half year ended Sep 2025 is -1.80% vs 5.41% in Sep 2024
Growth in half year ended Sep 2025 is -37.94% vs -1.30% in Sep 2024
Nine Monthly Results Snapshot (Consolidated) - Dec'25
YoY Growth in nine months ended Dec 2025 is 3.05% vs 0.68% in Dec 2024
YoY Growth in nine months ended Dec 2025 is -31.58% vs 2.85% in Dec 2024
Annual Results Snapshot (Consolidated) - Mar'26
YoY Growth in year ended Mar 2026 is 3.53% vs -5.99% in Mar 2025
YoY Growth in year ended Mar 2026 is -34.64% vs -6.15% in Mar 2025
About H.G. Infra Engineering Ltd

Company Coordinates


