
Compare Unifinz Capital with Similar Stocks
Dashboard
Strong Long Term Fundamental Strength with an average Return on Equity (ROE) of 19.79%
Healthy long term growth as Net Sales has grown by an annual rate of 248.23% and Operating profit at 173.47%
With a growth in Net Sales of 3.06%, the company declared Very Positive results in Mar 26
With ROE of 53.1, it has a Very Attractive valuation with a 2.8 Price to Book Value
Majority shareholders : Non Institution
Underperformed the market in the last 1 year
Stock DNA
Non Banking Financial Company (NBFC)
INR 452 Cr (Micro Cap)
5.00
21
0.49%
1.69
53.09%
2.75
Total Returns (Price + Dividend) 
Latest dividend: 0.5 per share ex-dividend date: Apr-06-2026
Risk Adjusted Returns v/s
Returns Beta

News

Unifinz Capital India Ltd is Rated Hold by MarketsMOJO
Unifinz Capital India Ltd is rated 'Hold' by MarketsMOJO, with this rating last updated on 11 Nov 2025. While the rating was assigned on that date, the analysis and financial metrics discussed here reflect the stock’s current position as of 22 June 2026, providing investors with an up-to-date perspective on the company’s fundamentals, valuation, financial trends, and technical outlook.
Read full news article
Unifinz Capital India Ltd is Rated Hold
Unifinz Capital India Ltd is rated 'Hold' by MarketsMOJO, with this rating last updated on 11 Nov 2025. While the rating was established on that date, the analysis and financial metrics discussed here reflect the company’s current position as of 11 June 2026, providing investors with an up-to-date perspective on the stock’s fundamentals, valuation, financial trends, and technical outlook.
Read full news article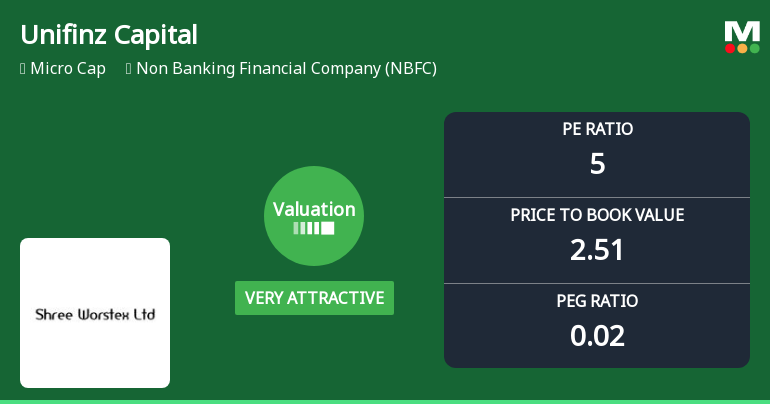
Unifinz Capital India Ltd Valuation Shifts Signal Renewed Price Attractiveness
Unifinz Capital India Ltd, a micro-cap player in the Non Banking Financial Company (NBFC) sector, has witnessed a significant shift in its valuation parameters, moving from a fair to a very attractive rating. This change comes amid a backdrop of mixed market performance and evolving investor sentiment, prompting a reassessment of the stock’s price attractiveness relative to its historical and peer averages.
Read full news article Announcements
Closure of Trading Window
25-Jun-2026 | Source : BSEClosure of trading window from 01/07/2026 till completion of 48 hours after declaration of limited reviewed Financial Results for the First Quarter to be ended on 30/06/2026.
Revised Disclosures under Reg. 29(2) of SEBI (SAST) Regulations 2011
20-Jun-2026 | Source : BSEThe Exchange has received the revised disclosure under Regulation 29(2) of SEBI (Substantial Acquisition of Shares & Takeovers) Regulations 2011 for Pawan Kumar Mittal & Kiran Mittal
Disclosures under Reg. 29(2) of SEBI (SAST) Regulations 2011
20-Jun-2026 | Source : BSEThe Exchange has received the disclosure under Regulation 29(2) of SEBI (Substantial Acquisition of Shares & Takeovers) Regulations 2011 for Pawan Kumar Mittal & Kiran Mittal
Corporate Actions

No Upcoming Board Meetings

Unifinz Capital India Ltd has declared 5% dividend, ex-date: 06 Apr 26

No Splits history available

Unifinz Capital India Ltd has announced 4:1 bonus issue, ex-date: 19 Dec 25

No Rights history available
Quality key factors
Valuation key factors
Technicals key factors
 Technical Indicator Scale: Bearish, Mildly Bearish, Sideways, Mildly Bullish, Bullish Turned
 Shareholding Snapshot : Mar 2026
Shareholding Compare (%holding)
Non Institution
None
Held by 0 Schemes
Held by 1 FIIs (11.29%)
Pawan Kumar Mittal (13.69%)
Paaven Bansal (20.14%)
45.6%
Quarterly Results Snapshot (Standalone) - Mar'26 - QoQ

QoQ Growth in quarter ended Mar 2026 is 3.06% vs 14.28% in Dec 2025
QoQ Growth in quarter ended Mar 2026 is -28.97% vs 12.52% in Dec 2025
Half Yearly Results Snapshot (Standalone) - Sep'25

Growth in half year ended Sep 2025 is 447.39% vs 200.78% in Sep 2024
Growth in half year ended Sep 2025 is 524.77% vs 3,747.06% in Sep 2024
Nine Monthly Results Snapshot (Standalone) - Dec'25
YoY Growth in nine months ended Dec 2025 is 373.29% vs 264.54% in Dec 2024
YoY Growth in nine months ended Dec 2025 is 435.65% vs 1,508.89% in Dec 2024
Annual Results Snapshot (Standalone) - Mar'26
YoY Growth in year ended Mar 2026 is 321.57% vs 307.21% in Mar 2025
YoY Growth in year ended Mar 2026 is 334.40% vs 1,859.65% in Mar 2025
About Unifinz Capital India Ltd

Company Coordinates


