
 Price Point
Compare Shahlon Silk with Similar Stocks
ScoreDashboard
Weak Long Term Fundamental Strength with a -0.58% CAGR growth in Net Sales over the last 5 years
- Low ability to service debt as the company has a high Debt to EBITDA ratio of 4.81 times
- The company has been able to generate a Return on Equity (avg) of 2.78% signifying low profitability per unit of shareholders funds
Negative results in Jun 26
Mojo ParametersStock DNA

Garments & Apparels

INR 211 Cr (Micro Cap)

49.00
28

0.27%

1.11

3.73%

1.81
Total ReturnsTotal Returns (Price + Dividend) 
Latest dividend: 0.06 per share ex-dividend date: Sep-18-2026
Risk Adjusted Returns v/s
Returns Beta
 News & Corporate Actions
News
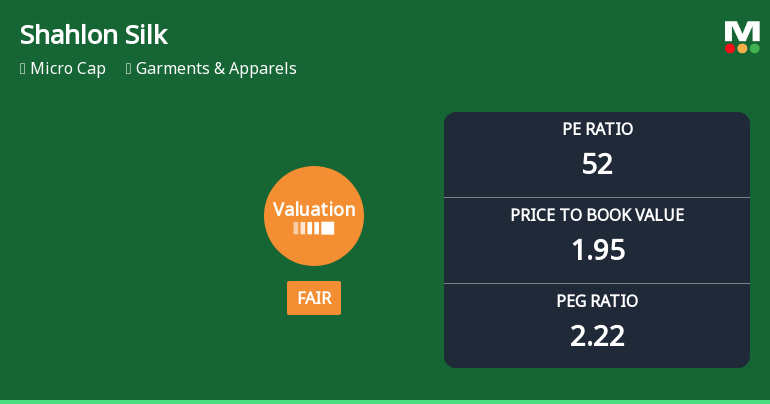
Shahlon Silk Industries Ltd: Valuation Shifts Signal Changing Market Sentiment
Shahlon Silk Industries Ltd has experienced a notable shift in its valuation parameters, moving from an attractive to a fair valuation grade. This change, coupled with a recent downgrade in its Mojo Grade from Hold to Sell, signals a cautious outlook for investors amid a competitive garments and apparels sector. A detailed analysis of its price-to-earnings (P/E) and price-to-book value (P/BV) ratios against historical and peer averages reveals the evolving price attractiveness of this micro-cap stock.
Read full news article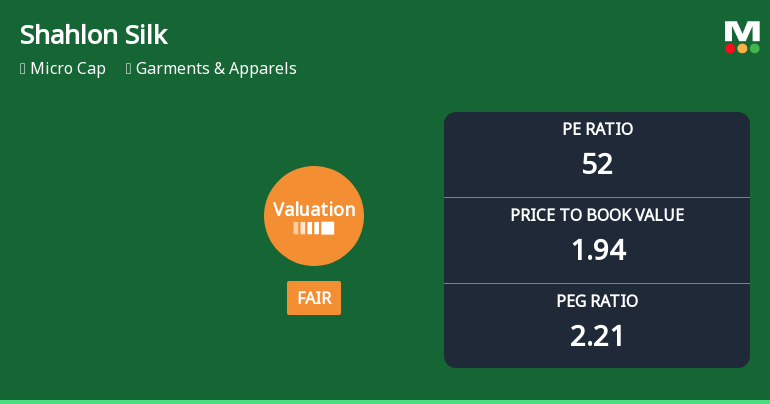
Shahlon Silk Industries Ltd Valuation Shifts to Fair Amidst Strong Returns
Shahlon Silk Industries Ltd, a micro-cap player in the Garments & Apparels sector, has seen its valuation grade shift from attractive to fair amid rising price-to-earnings and price-to-book ratios. This article examines the implications of these changes in valuation parameters, compares the company’s metrics against peers and historical averages, and assesses the stock’s price attractiveness in the current market context.
Read full news article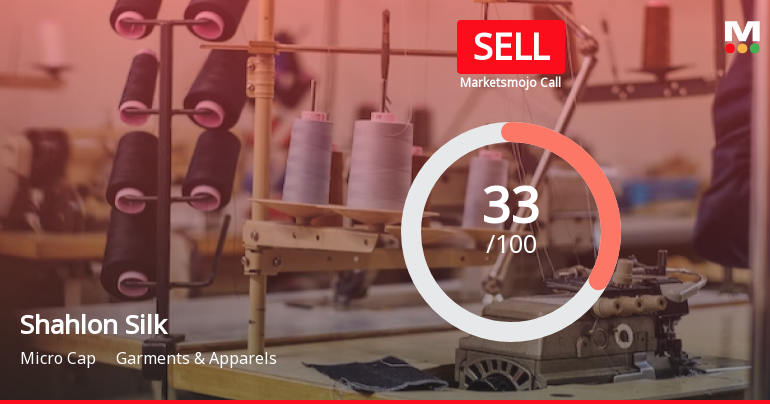
Shahlon Silk Industries Ltd is Rated Sell
Shahlon Silk Industries Ltd is rated 'Sell' by MarketsMOJO, with this rating last updated on 06 August 2026. However, all fundamentals, returns, and financial metrics discussed here reflect the stock's current position as of 14 September 2026, providing investors with the latest comprehensive analysis.
Read full news article Announcements
Announcement under Regulation 30 (LODR)-Newspaper Publication
09-Sep-2026 | Source : BSENewspaper Publication concerning 18th Annual General Meeting to be held on Wednesday September 30 2026 at 11:00 a.m. (IST) through Video Conferencing / Other Audio Visual Means ("VC / OAVM") facility Book Closure Period Dividend And Remote E-Voting Information
Notice Of The 18Th Annual General Meeting (AGM)
07-Sep-2026 | Source : BSEWe are pleased to enclose herewith Annual Report of the Company for the FY 2025-26 inter alia comprising the Notice of the 18th Annual General Meeting
Reg. 34 (1) Annual Report.
07-Sep-2026 | Source : BSEPursuant to Regulation 34(1) of SEBI (Listing Obligations and Disclosure Requirements) Regulations 2015 we submit herewith Annual Report of the Company for the Financial Year ended March 31 2026.
Corporate Actions

No Upcoming Board Meetings

Shahlon Silk Industries Ltd has declared 3% dividend, ex-date: 18 Sep 26

Shahlon Silk Industries Ltd has announced 2:10 stock split, ex-date: 11 Nov 21

No Bonus history available

No Rights history available
Key FactorsQuality key factors
Valuation key factors
Technicals key factors
 Technical Indicator Scale: Bearish, Mildly Bearish, Sideways, Mildly Bullish, Bullish Turned Shareholding
Shareholding Snapshot : Jun 2026
Shareholding Compare (%holding)
Promoters
None
Held by 0 Schemes
Held by 2 FIIs (0.38%)
Nitin Raichand Shah . (9.61%)
Niveza Small Cap Fund (3.89%)
15.02%
FinancialQuarterly Results Snapshot (Standalone) - Jun'26 - QoQ
 Compare with Peers
QoQ Growth in quarter ended Jun 2026 is -54.50% vs 60.94% in Mar 2026
QoQ Growth in quarter ended Jun 2026 is -42.53% vs -33.59% in Mar 2026

Half Yearly Results Snapshot (Standalone) - Sep'25
Growth in half year ended Sep 2025 is 5.66% vs 21.65% in Sep 2024
Growth in half year ended Sep 2025 is 2.73% vs 2.80% in Sep 2024
Nine Monthly Results Snapshot (Standalone) - Dec'25
YoY Growth in nine months ended Dec 2025 is -5.81% vs 37.21% in Dec 2024

YoY Growth in nine months ended Dec 2025 is 12.97% vs 12.46% in Dec 2024
Annual Results Snapshot (Standalone) - Mar'26
YoY Growth in year ended Mar 2026 is 3.30% vs -19.17% in Mar 2025
YoY Growth in year ended Mar 2026 is 27.14% vs -12.06% in Mar 2025
 Company CV
About Shahlon Silk Industries Ltd

Company Coordinates








