
Compare DC Infotech with Similar Stocks
Dashboard
High Management Efficiency with a high ROCE of 27.63%
Strong ability to service debt as the company has a low Debt to EBITDA ratio of 1.94 times
Healthy long term growth as Operating profit has grown by an annual rate 42.71%
The company has declared Positive results for the last 3 consecutive quarters
With ROCE of 35, it has a Fair valuation with a 4.8 Enterprise value to Capital Employed
Majority shareholders : Promoters
Total Returns (Price + Dividend) 
DC Infotech for the last several years.
Risk Adjusted Returns v/s
Returns Beta

News

DC Infotech & Communication Ltd is Rated Hold
DC Infotech & Communication Ltd is rated 'Hold' by MarketsMOJO, with this rating last updated on 25 May 2026. However, the analysis and financial metrics discussed here reflect the company’s current position as of 23 June 2026, providing investors with an up-to-date view of its fundamentals, returns, and overall market stance.
Read full news article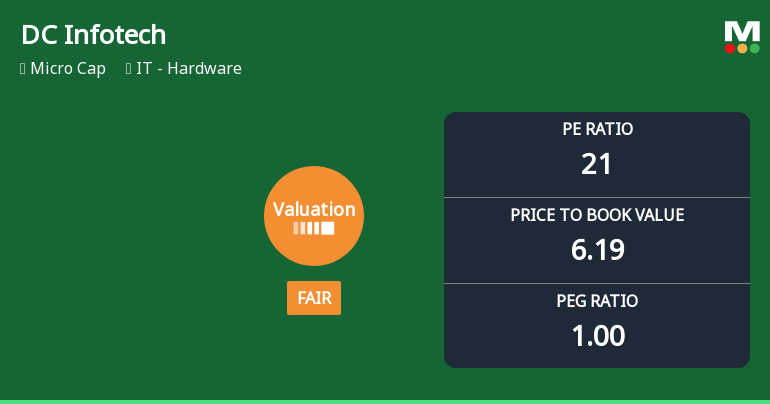
DC Infotech & Communication Ltd Valuation Shifts Signal Changing Market Sentiment
DC Infotech & Communication Ltd, a micro-cap player in the IT - Hardware sector, has seen its valuation grade shift from attractive to fair, reflecting evolving market perceptions amid changing price-to-earnings and price-to-book ratios. This article analyses the implications of these valuation changes, comparing them with historical trends and peer benchmarks to provide investors with a comprehensive view of the stock’s price attractiveness.
Read full news article
DC Infotech & Communication Ltd is Rated Hold
DC Infotech & Communication Ltd is rated 'Hold' by MarketsMOJO, with this rating last updated on 25 May 2026. However, the analysis and financial metrics presented here reflect the company’s current position as of 12 June 2026, providing investors with an up-to-date view of its fundamentals, returns, and overall market stance.
Read full news article Announcements
Announcement under Regulation 30 (LODR)-Analyst / Investor Meet - Outcome
08-Jun-2026 | Source : BSEWe wish to inform you that pursuant to Regulation 30 of the Securities and Exchange Board of India (Listing Obligations and Disclosure Requirements) Regulations 2015 please find below transcript for audio recording of Earnings Conference Call of DC Infotech & Communications Limited held on 04th June 2026 at 04:00 pm to discuss the Companys business and financial performance for Q4 & FY26.
Announcement under Regulation 30 (LODR)-Analyst / Investor Meet - Outcome
04-Jun-2026 | Source : BSEPursuant to the provisions of Regulation 30 of the SEBI (Listing Obligations and Disclosure Requirement) Regulations 2015 please find below link for audio recording of Earnings Conference Call of DC Infotech & Communications Limited held on 30th May 2025 at 4:00 pm to discuss the Companys business and financial performance for Q4 & FY26. Link https://dcinfotech.com/investor-relationship.php in announcement tab
Announcement under Regulation 30 (LODR)-Investor Presentation
03-Jun-2026 | Source : BSEPlease find the investor Presentation for Q4 and Year Ended 31st March 2026
Corporate Actions

No Upcoming Board Meetings

No Dividend history available

No Splits history available

DC Infotech & Communication Ltd has announced 1:1 bonus issue, ex-date: 10 Jan 22

No Rights history available
Quality key factors
Valuation key factors
Technicals key factors
 Technical Indicator Scale: Bearish, Mildly Bearish, Sideways, Mildly Bullish, Bullish Turned
 Shareholding Snapshot : Mar 2026
Shareholding Compare (%holding)
Promoters
None
Held by 0 Schemes
Held by 2 FIIs (1.28%)
Chetankumar H Timbadia (20.57%)
Purvi Ketan Patel (3.15%)
30.3%
Quarterly Results Snapshot (Standalone) - Mar'26 - QoQ

QoQ Growth in quarter ended Mar 2026 is 22.29% vs 27.61% in Dec 2025
QoQ Growth in quarter ended Mar 2026 is -10.65% vs 29.34% in Dec 2025
Half Yearly Results Snapshot (Standalone) - Sep'25
Growth in half year ended Sep 2025 is 21.18% vs 22.52% in Sep 2024

Growth in half year ended Sep 2025 is 34.27% vs 28.63% in Sep 2024
Nine Monthly Results Snapshot (Standalone) - Dec'25
YoY Growth in nine months ended Dec 2025 is 29.84% vs 25.56% in Dec 2024
YoY Growth in nine months ended Dec 2025 is 44.06% vs 45.48% in Dec 2024
Annual Results Snapshot (Standalone) - Mar'26
YoY Growth in year ended Mar 2026 is 32.56% vs 20.91% in Mar 2025
YoY Growth in year ended Mar 2026 is 47.03% vs 24.89% in Mar 2025
About DC Infotech & Communication Ltd

Company Coordinates


