
 Price Point
Compare Fairchem Organic with Similar Stocks
ScoreDashboard
Strong ability to service debt as the company has a low Debt to EBITDA ratio of 2.51 times
Poor long term growth as Operating profit has grown by an annual rate -23.80% of over the last 5 years
With a growth in Net Profit of 171.27%, the company declared Very Positive results in Jun 26
With ROCE of 3.1, it has a Fair valuation with a 2.6 Enterprise value to Capital Employed
Falling Participation by Institutional Investors
Mojo ParametersStock DNA

Specialty Chemicals

INR 829 Cr (Micro Cap)

53.00
42

0.16%

0.31

5.80%

3.09
Total ReturnsTotal Returns (Price + Dividend) 
Latest dividend: 1 per share ex-dividend date: Jul-20-2026
Risk Adjusted Returns v/s
Returns Beta
 News & Corporate Actions
News
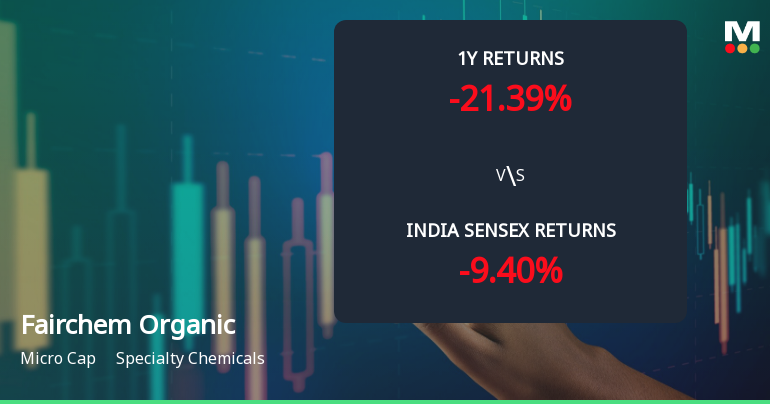
Fairchem Organics Ltd Technical Momentum Shifts Amid Mixed Indicator Signals
Fairchem Organics Ltd, a micro-cap player in the Specialty Chemicals sector, has recently exhibited a subtle shift in its technical momentum, moving from a sideways trend to a mildly bullish stance. Despite this positive tilt, the stock’s technical indicators present a nuanced picture, with mixed signals from MACD, RSI, Bollinger Bands, and moving averages, reflecting a complex market sentiment as the company navigates challenging industry dynamics.
Read full news article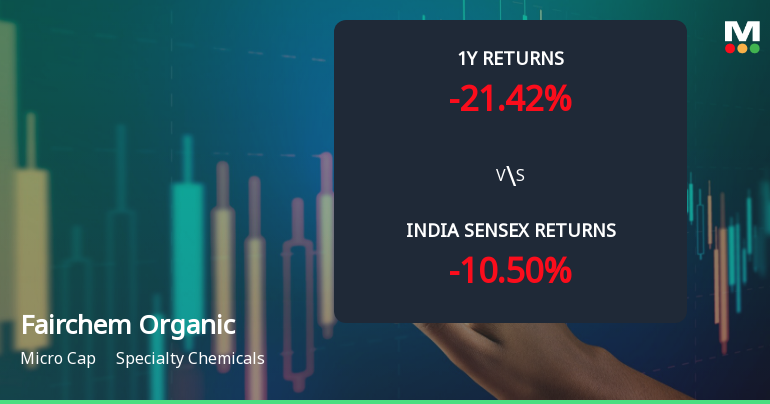
Fairchem Organics Ltd Technical Momentum Shifts Amid Mixed Indicator Signals
Fairchem Organics Ltd, a micro-cap player in the Specialty Chemicals sector, has experienced a notable shift in its technical momentum, moving from a mildly bullish stance to a sideways trend. Recent technical indicators reveal a complex picture with mixed signals across weekly and monthly timeframes, reflecting uncertainty in price direction despite the stock’s current price hovering near ₹635.
Read full news article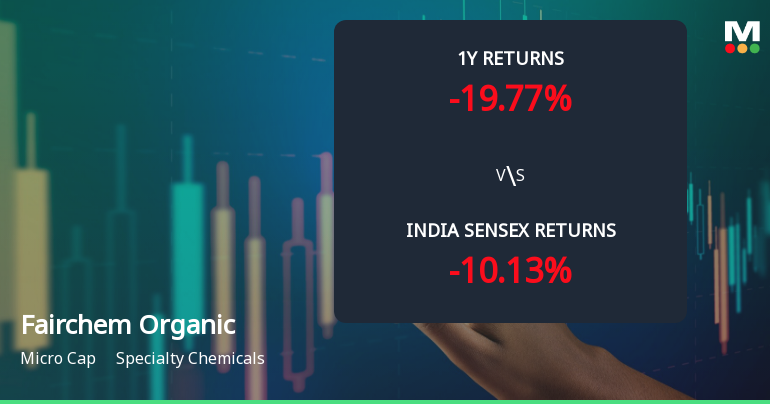
Fairchem Organics Ltd Technical Momentum Shifts Amid Mixed Indicator Signals
Fairchem Organics Ltd, a micro-cap player in the specialty chemicals sector, has experienced a notable shift in its technical momentum, moving from a sideways trend to a mildly bullish stance. Despite a recent downgrade in its Mojo Grade from Buy to Hold, the stock’s price action and technical indicators reveal a complex picture of cautious optimism for investors.
Read full news article Announcements
Announcement under Regulation 30 (LODR)-Earnings Call Transcript
30-Jul-2026 | Source : BSEPlease find attached herewith transcript of Earnings Con-Call held on Tuesday July 28 2026 for the Unaudited Financial Results for the Quarter Ended June 30 2026
Announcement under Regulation 30 (LODR)-Newspaper Publication
28-Jul-2026 | Source : BSEPlease find attached herewith the extracts of Unaudited Financial Results for the Quarter Ended June 30 2026 published in Newspaper on July 28 2026
Audio Link For Earnings Con-Call
28-Jul-2026 | Source : BSEPlease find attached herewith the Audio Link for Earnings Con-call for Unaudited Financial Results for QE June 30 2026
Corporate Actions

No Upcoming Board Meetings

Fairchem Organics Ltd has declared 10% dividend, ex-date: 20 Jul 26

No Splits history available

No Bonus history available

No Rights history available
Key FactorsQuality key factors
Valuation key factors
Technicals key factors
 Technical Indicator Scale: Bearish, Mildly Bearish, Sideways, Mildly Bullish, Bullish Turned Shareholding
Shareholding Snapshot : Jun 2026
Shareholding Compare (%holding)
Promoters
None
Held by 1 Schemes (0.0%)
Held by 8 FIIs (6.34%)
Fih Mauritius Investments Ltd (54.61%)
Massachusetts Institute Of Technology (3.33%)
19.05%
FinancialQuarterly Results Snapshot (Standalone) - Jun'26 - QoQ
 Compare with Peers
QoQ Growth in quarter ended Jun 2026 is 50.65% vs 16.78% in Mar 2026

QoQ Growth in quarter ended Jun 2026 is 171.27% vs 3,790.00% in Mar 2026

Half Yearly Results Snapshot (Standalone) - Sep'25
Growth in half year ended Sep 2025 is -20.08% vs -2.78% in Sep 2024
Growth in half year ended Sep 2025 is -89.08% vs 8.84% in Sep 2024
Nine Monthly Results Snapshot (Standalone) - Dec'25
YoY Growth in nine months ended Dec 2025 is -17.84% vs -9.30% in Dec 2024
YoY Growth in nine months ended Dec 2025 is -91.35% vs -25.61% in Dec 2024
Annual Results Snapshot (Standalone) - Mar'26
YoY Growth in year ended Mar 2026 is -14.55% vs -13.45% in Mar 2025
YoY Growth in year ended Mar 2026 is -74.78% vs -45.75% in Mar 2025
 Company CV
About Fairchem Organics Ltd

Company Coordinates








