
Compare India Pesticides with Similar Stocks
Dashboard
The company is Net-Debt Free
Poor long term growth as Operating profit has grown by an annual rate -7.19% of over the last 5 years
The company has declared Positive results for the last 5 consecutive quarters
With ROE of 11.9, it has a Very Attractive valuation with a 1.9 Price to Book Value
Despite the size of the company, domestic mutual funds hold only 0% of the company
Consistent Underperformance against the benchmark over the last 3 years
Stock DNA
Pesticides & Agrochemicals
INR 1,919 Cr (Small Cap)
16.00
29
0.45%
-0.01
11.86%
1.90
Total Returns (Price + Dividend) 
Latest dividend: 0.7534387895460798 per share ex-dividend date: Aug-12-2025
Risk Adjusted Returns v/s
Returns Beta

News
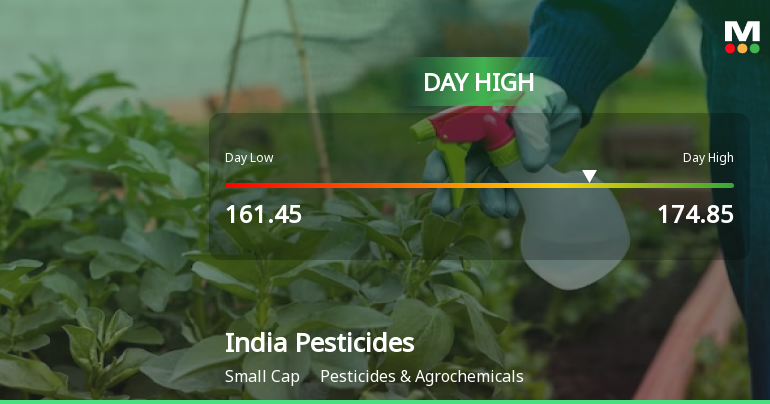
India Pesticides Ltd Surges 7.65% to Day's High of Rs 174.85 — Outperforms Sector by 8.84 Percentage Points
The Sensex advanced 0.58% on 22 Jun 2026, yet India Pesticides Ltd outpaced the broader market with a robust 7.65% gain, reaching an intraday peak of Rs 174.85. This 8.84-percentage-point outperformance over its sector signals a distinctly stock-specific rally rather than a market-wide lift.
Read full news article
India Pesticides Ltd is Rated Hold
India Pesticides Ltd is rated 'Hold' by MarketsMOJO, with this rating last updated on 07 May 2026. However, the analysis and financial metrics discussed here reflect the stock's current position as of 21 June 2026, providing investors with an up-to-date view of the company’s fundamentals, valuation, financial trends, and technical outlook.
Read full news article
India Pesticides Ltd is Rated Hold
India Pesticides Ltd is rated 'Hold' by MarketsMOJO, with this rating last updated on 07 May 2026. However, the analysis and financial metrics discussed here reflect the stock's current position as of 10 June 2026, providing investors with an up-to-date view of the company’s fundamentals, valuation, financial trends, and technical outlook.
Read full news article Announcements
Intimation Regarding Reconstitution Of The Committees
17-Jun-2026 | Source : BSEIntimation regarding reconstitution of the Committees
Announcement under Regulation 30 (LODR)-Resignation of Director
06-Jun-2026 | Source : BSEIntimation for Resignation of Director
Intimation Regarding Approval Of The Fungicide
30-May-2026 | Source : BSEIntimation regarding approval of the Fungicide
Corporate Actions

No Upcoming Board Meetings

India Pesticides Ltd has declared 75% dividend, ex-date: 12 Aug 25

No Splits history available

No Bonus history available

No Rights history available
Quality key factors
Valuation key factors
Technicals key factors
 Technical Indicator Scale: Bearish, Mildly Bearish, Sideways, Mildly Bullish, Bullish Turned
 Shareholding Snapshot : Mar 2026
Shareholding Compare (%holding)
Promoters
None
Held by 1 Schemes (0.0%)
Held by 18 FIIs (1.87%)
Anand Swarup Agarwal (31.15%)
Asha Agarwal (3.16%)
17.8%
Quarterly Results Snapshot (Consolidated) - Mar'26 - QoQ

QoQ Growth in quarter ended Mar 2026 is 18.24% vs -22.38% in Dec 2025
QoQ Growth in quarter ended Mar 2026 is 34.95% vs -28.22% in Dec 2025
Half Yearly Results Snapshot (Consolidated) - Sep'25
Growth in half year ended Sep 2025 is 25.92% vs 11.34% in Sep 2024
Growth in half year ended Sep 2025 is 46.55% vs 29.65% in Sep 2024
Nine Monthly Results Snapshot (Consolidated) - Dec'25
YoY Growth in nine months ended Dec 2025 is 27.29% vs 12.14% in Dec 2024
YoY Growth in nine months ended Dec 2025 is 45.15% vs 4.17% in Dec 2024
Annual Results Snapshot (Consolidated) - Mar'26
YoY Growth in year ended Mar 2026 is 27.62% vs 21.78% in Mar 2025
YoY Growth in year ended Mar 2026 is 45.81% vs 36.58% in Mar 2025
About India Pesticides Ltd

Company Coordinates


