Bharat Rasayan

  • Market Cap: Small Cap
  • Industry: Pesticides & Agrochemicals
  • ISIN: INE838B01021
  • NSEID: BHARATRAS
  • BSEID: 590021
INR
1,134.95
6.6 (0.58%)
BSENSE

Sep 23, 02:44 PM

BSE+NSE Vol: 5.17 k

  • Price Points
  • Score
  • Mojo Parameters
  • Total Return
  • News and Corporate Actions
  • Key factors
  • Shareholding
  • Financials
  • CompanyCV
stock-summaryPrice Point
High/Low

1Day

52 Week

Valuation
Technical
Day's Volume

CASH

5.17 k (-60.40%) Volume

Shareholding (Jun 2026)

FII

0.41%

Held by 33 FIIs

DII

1.99%

Held by 2 DIIs

Promoter

74.99%

Why is Bharat Rasayan Ltd falling/rising?

06-Sep-2026

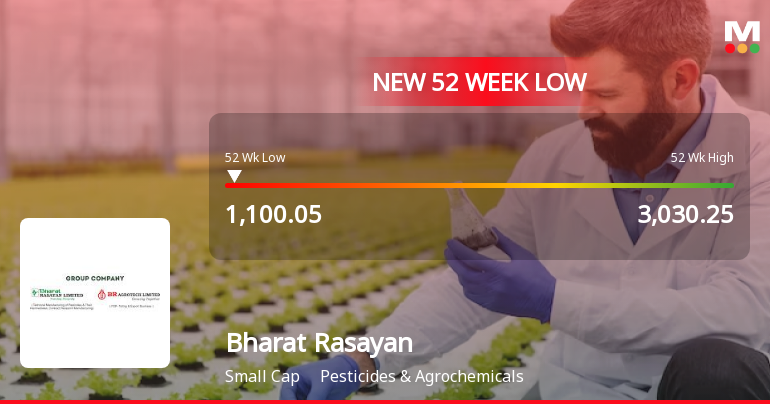
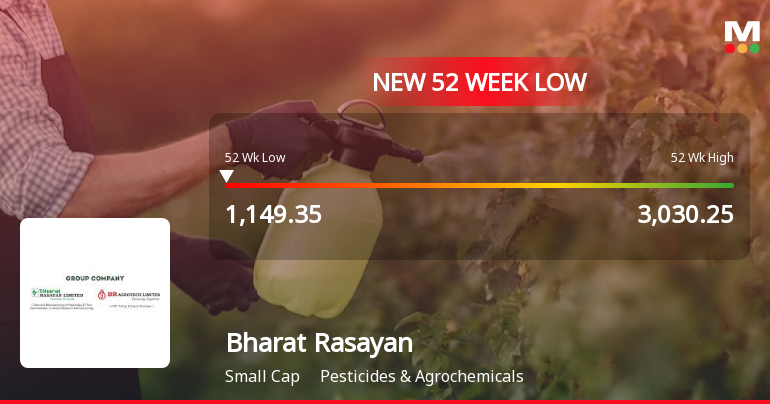
As of 05-Sep, Bharat Rasayan Ltd's stock is declining, having fallen 1.09% today and reaching a new 52-week low of Rs. 1170. The stock has significantly underperformed the Sensex and shows troubling long-term financial trends, with a year-to-date drop of 47.35% and a consistent decline in key financial metrics.

As of 05-Sep, Bharat Rasayan Ltd's stock price is currently falling, with a change of -12.9, representing a decline of 1.09%. This downward movement is reflected in the stock's recent performance, as it has underperformed against the benchmark Sensex, which has only decreased by 0.97% over the past week. The stock has also reached a new 52-week low of Rs. 1170 today.<BR><BR>Over the past month, Bharat Rasayan Ltd has experienced a significant decline of 12.57%, and its year-to-date performance shows a staggering drop of 47.35%. In the last year, the stock has fallen by 54.05%, which is considerably worse than the Sensex's decline of 5.21%. This consistent underperformance against the benchmark indicates a troubling trend for investors.<BR><BR>The company's financials reveal a concerning picture as well. Operating profit has decreased at an annual rate of -6.23% over the last five years, and key financial metrics such as profit before tax and net sales have also shown substantial declines. Specifically, profit before tax has fallen by 29.74%, while net sales have decreased by 10.40% in the most recent quarter.<BR><BR>Despite some positive indicators, such as a rising investor participation with a 131.85% increase in delivery volume, the overall sentiment remains negative due to the stock's poor long-term growth prospects and consistent underperformance. The stock is trading below all its moving averages, further indicating a bearish trend. Thus, the combination of declining financial performance, significant losses over various periods, and a lack of recovery in stock price contributes to the current downward trajectory of Bharat Rasayan Ltd's stock.

View full answer

Who are in the management team of Bharat Rasayan?

01-Sep-2026

The management team of Bharat Rasayan includes S N Gupta (Chairman & Managing Director), Mahabir Prasad Gupta, Rajender Prasad Gupta, Ajay Gupta (all Whole-Time Directors), and several Independent Non-Executive Directors, along with Nikita Chadha as Company Secretary. This team is responsible for the company's governance and strategic direction.

The management team of Bharat Rasayan includes the following key individuals:<BR><BR>1. **S N Gupta** - Chairman & Managing Director<BR>2. **Mahabir Prasad Gupta** - Whole-Time Director & Executive Director<BR>3. **Rajender Prasad Gupta** - Whole-Time Director & Executive Director<BR>4. **Ajay Gupta** - Executive Director & Whole-Time Director<BR>5. **Kamleshwar Prasad Uniyal** - Executive Director<BR>6. **Pankaj Gupta** - Independent Non-Executive Director<BR>7. **Ram Kanwar** - Independent Non-Executive Director<BR>8. **Sujata Agarwal** - Independent Non-Executive Director<BR>9. **Suresh Kumar Garg** - Independent Non-Executive Director<BR>10. **Ankit Aggarwal** - Independent Non-Executive Director<BR>11. **Nikita Chadha** - Company Secretary<BR><BR>This team plays a crucial role in the governance and strategic direction of the company.

View full answer

What does Bharat Rasayan do?

01-Sep-2026

Bharat Rasayan Ltd is a small-cap company in the pesticides and agrochemicals sector, specializing in technical grade pesticides and intermediates. As of June 2026, it reported net sales of ₹338 Cr and a net profit of ₹37 Cr, with a market cap of ₹2,079 Cr.

Overview:<BR>Bharat Rasayan Ltd is a small-cap company operating in the pesticides and agrochemicals industry, specializing in the manufacturing of technical grade pesticides and intermediates.<BR><BR>History:<BR>Bharat Rasayan Limited was incorporated as a Public Limited Company on May 15, 1989. The latest quarterly results reported net sales and profit for the period ending June 2026.<BR><BR>Financial Snapshot:<BR>- Net Sales: 338 Cr (Quarterly Results - Jun 2026)<BR>- Net Profit: 37 Cr (Quarterly Results - Jun 2026)<BR>- Market Cap: INR 2,079 Cr (Small Cap)<BR><BR>Key Metrics:<BR>- P/E: 14.00<BR>- Industry P/E: 26<BR>- Dividend Yield: 0.03%<BR>- Debt-Equity: -0.21<BR>- Return on Equity: 12.52%<BR>- Price to Book: 1.64<BR><BR>Contact Details:<BR>Address: 1501 Vikram Tower, Rajendra Place New Delhi New Delhi : 110008 <BR>Tel: 91-11-41538383/43661111 <BR>Email: invester.brl@bharatgroup.co.in <BR>Website: http://www.bharatgroup.co.in

View full answer

Who are the peers of the Bharat Rasayan?

01-Sep-2026

Bharat Rasayan's peers include Dhanuka Agritech, Rallis India, NACL Industries, and others, with varying management risks and growth rates. Notably, Bharat Rasayan has a low 1-year return of -50.71%, significantly underperforming compared to its peers.

Peers: The peers of Bharat Rasayan are Dhanuka Agritech, Rallis India, NACL Industries, Bhagiradha Chem., Insecticid.India, India Pesticides, Meghmani Organi., Punjab Chemicals, and Astec Lifescienc.<BR><BR>Quality Snapshot: Excellent management risk is observed at Dhanuka Agritech, while Average management risk is found at Rallis India, NACL Industries, Bhagiradha Chem., Bharat Rasayan, Insecticid.India, India Pesticides, and Punjab Chemicals, and the rest. Below Average management risk is noted at Meghmani Organi. and Astec Lifescienc. All peers exhibit Below Average growth, except for Bhagiradha Chem., which has Good growth. Bharat Rasayan, Insecticid.India, India Pesticides, and Dhanuka Agritech have Excellent capital structure, while Rallis India and Punjab Chemicals have Excellent capital structure, and the rest have Below Average or Average capital structure.<BR><BR>Return Snapshot: Bhagiradha Chem. has the highest 1-year return at 8.27%, while Bharat Rasayan has the lowest at -50.71%. Compared to its peers, Bharat Rasayan's 1-year return is significantly lower. Additionally, NACL Industries, Meghmani Organi., Punjab Chemicals, and Astec Lifescienc have negative six-month returns.

View full answer

How big is Bharat Rasayan?

01-Sep-2026

As of 31st August, Bharat Rasayan Ltd has a market capitalization of 2,079.00 Cr, with recent Net Sales of 1,202.60 Cr and a Net Profit of 143.29 Cr.

As of 31st August, Bharat Rasayan Ltd has a market capitalization of 2,079.00 Cr, categorizing it as a Small Cap company.<BR><BR>In the latest four quarters, Bharat Rasayan reported Net Sales of 1,202.60 Cr and a Net Profit of 143.29 Cr.<BR><BR>The latest annual period for the balance sheet is March 2025, with Shareholder's Funds amounting to 1,130.00 Cr and Total Assets of 1,408.14 Cr.

View full answer

Should I buy, sell or hold Bharat Rasayan Ltd?

15-Aug-2026

Are Bharat Rasayan Ltd latest results good or bad?

27-May-2026

Bharat Rasayan Ltd's latest results show a 51.81% year-on-year increase in net profit to ₹38.15 crores, but a 4.70% decline from the previous quarter. While there are positive trends in profit and margins, long-term growth challenges and declining return on equity suggest caution for investors.

Bharat Rasayan Ltd's latest results present a mixed picture. For the quarter ending March 2026, the company reported a net profit of ₹38.15 crores, which is a significant increase of 51.81% year-on-year. However, this figure reflects a decline of 4.70% compared to the previous quarter, indicating some loss of momentum.<BR><BR>Net sales for the same quarter were ₹308.02 crores, showing a slight year-on-year growth of 0.49% and a notable quarter-on-quarter increase of 13.89%. The operating margin improved to 16.27%, up from 13.11% a year earlier, which suggests enhanced operational efficiency.<BR><BR>Despite the positive year-on-year profit growth, it's important to note that the company has faced challenges over the longer term, including a five-year average sales growth of just 2.56% and a concerning EBIT contraction of 3.65% annually. The return on equity (ROE) has also declined to 12.04%, below its five-year average of 15.82%, raising concerns about shareholder value creation.<BR><BR>Overall, while the latest quarterly results show some positive trends, particularly in profit and margins, the longer-term performance metrics and market conditions suggest that the company is navigating significant challenges in the agrochemical sector. Investors may want to approach with caution, considering both the recent improvements and the underlying structural issues.

View full answer

Is Bharat Rasayan technically bullish or bearish?

27-Nov-2025

As of November 26, 2025, the trend is mildly bullish with supportive MACD signals, but caution is advised due to bearish weekly KST and Bollinger Bands, alongside a lack of momentum in the RSI.

As of 26 November 2025, the technical trend has changed from sideways to mildly bullish. The current stance is mildly bullish, supported by bullish MACD signals on both the weekly and monthly time frames, and a bullish daily moving average. However, the weekly KST is mildly bearish and the Bollinger Bands indicate a sideways trend on the weekly, with a bearish monthly outlook. The RSI shows no signals on both time frames, indicating a lack of momentum. Overall, while there are bullish indicators, the presence of bearish signals in other areas suggests caution.

View full answer

How has been the historical performance of Bharat Rasayan?

12-Nov-2025

Bharat Rasayan's historical performance shows fluctuating financial metrics, with net sales increasing to 1,173.00 Cr in March 2025 but declining from 1,234.34 Cr in March 2023. Despite rising costs, operating profit improved to 200.90 Cr, and profit after tax rose to 125.10 Cr, indicating a mixed performance with growth in sales and profits.

Answer:<BR>The historical performance of Bharat Rasayan shows fluctuations in key financial metrics over the years, with notable trends in revenue, profit, and assets.<BR><BR>Breakdown:<BR>Bharat Rasayan's net sales reached 1,173.00 Cr in March 2025, an increase from 1,044.63 Cr in March 2024, but a decline from 1,234.34 Cr in March 2023. The total operating income followed a similar trend, peaking at 1,301.15 Cr in March 2022 before decreasing in subsequent years. The company's total expenditure, excluding depreciation, was 998.12 Cr in March 2025, up from 927.36 Cr in March 2024, reflecting rising raw material costs which were 824.54 Cr in March 2025. Operating profit (PBDIT) was 200.90 Cr in March 2025, showing an increase from 138.17 Cr in March 2024, although it was lower than the 266.67 Cr recorded in March 2022. Profit before tax stood at 169.19 Cr in March 2025, compared to 109.42 Cr in March 2024, while profit after tax was 125.10 Cr, up from 81.61 Cr in the previous year. The company's total assets increased to 1,408.14 Cr in March 2025 from 1,197.45 Cr in March 2024, with total liabilities also rising to 1,408.14 Cr. Cash flow from operating activities improved to 172.00 Cr in March 2025, up from 41.00 Cr in March 2024, indicating a positive cash flow trend. Overall, Bharat Rasayan's financial performance reflects a mix of growth in sales and profits alongside rising costs and liabilities.

View full answer

Is Bharat Rasayan overvalued or undervalued?

12-Aug-2025

As of August 11, 2025, Bharat Rasayan is considered very expensive and overvalued with a PE ratio of 33.63, elevated valuation metrics compared to industry norms, and a PEG ratio of 0.71, despite outperforming the Sensex in the short term.

As of 11 August 2025, Bharat Rasayan's valuation grade has moved from expensive to very expensive, indicating a significant shift in its perceived market value. The company is currently considered overvalued. Key ratios include a PE ratio of 33.63, an EV to EBITDA of 25.95, and a Price to Book Value of 4.19, which are all elevated compared to industry norms.<BR><BR>In comparison to its peers, Bharat Rasayan's PE ratio is lower than P I Industries at 35.18 and Bayer CropScience at 42.61, but higher than UPL, which has a PE of 34.55. The PEG ratio of 0.71 suggests some growth potential, yet the overall high valuation metrics indicate that the stock may not offer a favorable risk-reward profile at this time. Notably, while Bharat Rasayan has outperformed the Sensex in the short term, its longer-term performance has lagged, further supporting the view that it is currently overvalued.

View full answer

Who are the top shareholders of the Bharat Rasayan?

17-Jul-2025

The top shareholders of Bharat Rasayan include Sat Narain Gupta, the largest promoter with 23.83%, followed by Ritesh Stock Broking Private Limited at 4.72%, mutual funds with 2.55%, and foreign institutional investors holding 0.49%. Individual investors collectively own 11.23% of the shares.

The top shareholders of Bharat Rasayan include the promoters, who hold the majority of the shares. The promoter with the highest holding is Sat Narain Gupta, with 23.83%. Additionally, Ritesh Stock Broking Private Limited is the highest public shareholder, owning 4.72%. The company also has mutual funds holding 2.55% through two schemes, and foreign institutional investors (FIIs) hold 0.49% across 32 entities. Individual investors collectively own 11.23% of the shares.

View full answer

When is the next results date for Bharat Rasayan?

06-Jun-2025

No Upcoming Board Meetings

Has Bharat Rasayan declared dividend?

06-Jun-2025

Yes, Bharat Rasayan Ltd. has declared a 15% dividend, amounting to ₹1.5 per share, with an ex-date of September 12, 2024. However, the company has experienced significant declines in price returns over various periods, indicating challenges in stock performance despite the dividend announcement.

Bharat Rasayan Ltd. has declared a 15% dividend.<BR><BR>Dividend Details:<BR>- Percentage announced: 15%<BR>- Amount per share: 1.5<BR>- Ex-date: 12 Sep 24<BR><BR>Dividend Yield: 0.02%.<BR><BR>Total Returns by Period:<BR>In the last 6 months, the price return was -22.48%, with a dividend return of 0%, resulting in a total return of -22.48%.<BR><BR>Over the past year, the price return was -14.14%, with a dividend return of 0.01%, leading to a total return of -14.13%.<BR><BR>In the 2-year period, the price return was -9.81%, with a dividend return of 0.03%, resulting in a total return of -9.78%.<BR><BR>For the 3-year period, the price return was -23.53%, with a dividend return of 0.04%, leading to a total return of -23.49%.<BR><BR>In the last 4 years, the price return was -31.16%, with a dividend return of 0.05%, resulting in a total return of -31.11%.<BR><BR>Over the 5-year period, the price return was 27.37%, with a dividend return of 0.10%, leading to a total return of 27.47%.<BR><BR>Overall, while Bharat Rasayan has declared a dividend, the total returns over various periods show significant declines in price returns, particularly in the shorter time frames, suggesting challenges in stock performance despite the dividend declaration.

View full answer
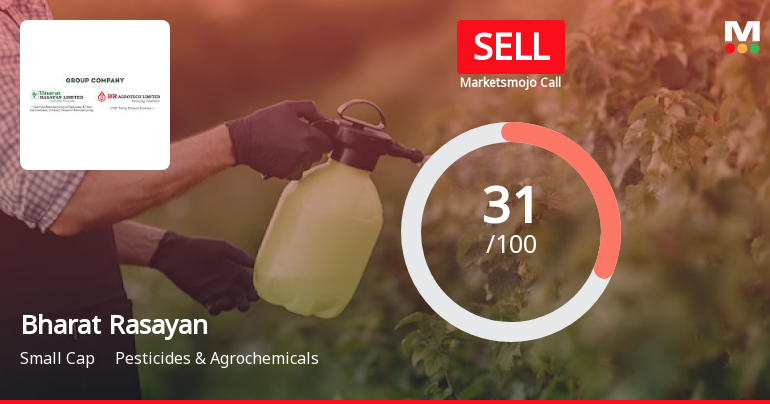
iScoreScore
Click here to find our call on this stock
Strong Sell
Sell
Hold
Buy
Strong Buy

Dashboard

1

Poor long term growth as Operating profit has grown by an annual rate -6.23% of over the last 5 years

  • PBT LESS OI(Q) At Rs 43.28 cr has Fallen at -29.74%
  • PAT(Q) At Rs 37.23 cr has Fallen at -26.3%
  • NET SALES(Q) At Rs 338.16 cr has Fallen at -10.40%
2

Consistent Underperformance against the benchmark over the last 3 years

stock-summaryMojo Parameters

Mojo Parameters

Loading Valuation Snapshot...

Stock DNA

stock-summary
Industry

Pesticides & Agrochemicals

stock-summary
Market cap

INR 1,886 Cr (Small Cap)

stock-summary
P/E

13.00

stock-summary
Industry P/E

25

stock-summary
Dividend Yield

0.04%

stock-summary
Debt Equity

-0.21

stock-summary
Return on Equity

12.52%

stock-summary
Price to Book

1.47

Revenue and Profits:
Net Sales:
338 Cr
(Quarterly Results - Jun 2026)
Net Profit:
37 Cr
stock-summaryTotal Returns
Total Returns (Price + Dividend) stock-summary
Dividend Yield (0.04%)
TimePeriod
Price Return
Dividend Return
Total Return
3 Months
-18.67%
0.04%
-18.63%
6 Months
-8.17%
0.04%
-8.13%
1 Year
-54.86%
0.02%
-54.84%
2 Years
-62.6%
0.03%
-62.57%
3 Years
-50.8%
0.05%
-50.75%
4 Years
-60.42%
0.06%
-60.36%
5 Years
-63.44%
0.07%
-63.37%

Latest dividend: 0.5 per share ex-dividend date: Sep-17-2026

Risk Adjusted Returns v/s stock-summary
Returns Beta
Icon
Beta has not been calculated since enough price history is not available
stock-summaryNews & Corporate Actions

Announcements stock-summary

Closure of Trading Window

21-Sep-2026 | Source : BSE

Bharat Rasayan Ltd has informed BSE regarding "Closure of Trading Window".

Standalone & Consolidated Financial Results Limited Review Report for June 30 2026

31-Aug-2026 | Source : BSE

Bharat Rasayan Ltd has informed BSE about :

1. Standalone Financial Results for the period ended June 30 2026

2. Consolidated Financial Results for the period ended June 30 2026

3. Standalone Limited Review for the period ended June 30 2026

4. Consolidated Limited Review for the period ended June 30 2026

Fixes Record Date for Final Dividend

31-Aug-2026 | Source : BSE

Bharat Rasayan Ltd has informed BSE that the Company has fixed September 17 2026 as the Record Date for the purpose of Payment of Final Dividend.

Corporate Actions stock-summary

stock-summary
BOARD MEETING

No Upcoming Board Meetings

stock-summary
DIVIDEND

Bharat Rasayan Ltd has declared 10% dividend, ex-date: 17 Sep 26

stock-summary
SPLITS

Bharat Rasayan Ltd has announced 5:10 stock split, ex-date: 12 Dec 25

stock-summary
BONUS

Bharat Rasayan Ltd has announced 1:1 bonus issue, ex-date: 12 Dec 25

stock-summary
RIGHTS

No Rights history available

stock-summaryKey Factors

Quality key factors stock-summary

Factor
Value
Sales Growth (5y)
2.52%
EBIT Growth (5y)
-6.23%
EBIT to Interest (avg)
32.97
Debt to EBITDA (avg)
0.44
Net Debt to Equity (avg)
-0.21
Sales to Capital Employed (avg)
1.15
Tax Ratio
23.92%
Dividend Payout Ratio
0.44%
Pledged Shares
0
Institutional Holding
2.40%
ROCE (avg)
19.69%
ROE (avg)
14.45%

Valuation key factors

Factor
Value
P/E Ratio
13
Industry P/E
25
Price to Book Value
1.47
EV to EBIT
10.69
EV to EBITDA
9.05
EV to Capital Employed
1.59
EV to Sales
1.33
PEG Ratio
NA
Dividend Yield
0.04%
ROCE (Latest)
17.22%
ROE (Latest)
12.52%

Technicals key factors

Indicator
Weekly
Monthly
MACD
Mildly Bullish
Bearish
RSI
No Signal
No Signal
Bollinger Bands
Bearish
Bearish
Moving Averages
Bearish (Daily)
KST
Bearish
Bearish
Dow Theory
Mildly Bearish
Mildly Bearish
OBV
Mildly Bullish
Mildly Bearish
stock-summary Technical Indicator Scale: Bearish, Mildly Bearish, Sideways, Mildly Bullish, Bullish  Turned 
stock-summaryShareholding
Shareholding Snapshot : Jun 2026stock-summary
Shareholding Compare (%holding) stock-summary
Majority shareholders

Promoters

Pledged Promoter Holdings

None

Mutual Funds

Held by 1 Schemes (1.89%)

FIIs

Held by 33 FIIs (0.41%)

Promoter with highest holding

Sat Narain Gupta (23.76%)

Highest Public shareholder

Ritesh Stock Broking Private Limited (4.76%)

Individual Investors Holdings

11.41%

stock-summaryFinancial
[
  {
    "link": "quarterly",
    "btn_text": "All Quarterly Results",
    "header": "Quarterly Results Snapshot (Consolidated) - Jun'26 - YoY",
    "rhs": [
      {
        "prefix": "Net Sales ",
        "suffix": "YoY Growth in quarter ended Jun 2026 is -10.40% vs 33.73% in Jun 2025",
        "dir": -1
      },
      {
        "prefix": "Consolidated Net Profit ",
        "suffix": "YoY Growth in quarter ended Jun 2026 is -6.13% vs -8.02% in Jun 2025",
        "dir": 1
      }
    ],
    "table": {
      "header": [
        "Jun'26",
        "Jun'25",
        "Change(%)"
      ],
      "body": [
        {
          "field": "Net Sales",
          "val1": "338.16",
          "val2": "377.40",
          "chgp": "-10.40%",
          "chgp_class": "negative"
        },
        {
          "field": "Operating Profit (PBDIT) excl Other Income",
          "val1": "50.77",
          "val2": "73.17",
          "chgp": "-30.61%",
          "chgp_class": "negative"
        },
        {
          "field": "Interest",
          "val1": "1.02",
          "val2": "1.18",
          "chgp": "-13.56%",
          "chgp_class": "positive"
        },
        {
          "field": "Exceptional Items",
          "val1": "0.00",
          "val2": "-14.78",
          "chgp": "100.00%",
          "chgp_class": "positive"
        },
        {
          "field": "Consolidate Net Profit",
          "val1": "37.23",
          "val2": "39.66",
          "chgp": "-6.13%",
          "chgp_class": "negative"
        },
        {
          "field": "Operating Profit Margin (Excl OI)",
          "val1": "15.01%",
          "val2": "19.39%",
          "chgp": "-4.38%",
          "chgp_class": "negative"
        }
      ]
    }
  },
  {
    "link": "half-yearly",
    "btn_text": "All Half Yearly Results",
    "header": "Half Yearly Results Snapshot (Consolidated) - Sep'25",
    "rhs": [
      {
        "prefix": "Net Sales ",
        "suffix": " Growth in half year ended Sep 2025 is 8.74% vs 21.51% in Sep 2024",
        "dir": -1
      },
      {
        "prefix": "Consolidated Net Profit ",
        "suffix": " Growth in half year ended Sep 2025 is -10.26% vs 474.94% in Sep 2024",
        "dir": -1
      }
    ],
    "table": {
      "header": [
        "Sep'25",
        "Sep'24",
        "Change(%)"
      ],
      "body": [
        {
          "field": "Net Sales",
          "val1": "663.36",
          "val2": "610.07",
          "chgp": "8.74%",
          "chgp_class": "positive"
        },
        {
          "field": "Operating Profit (PBDIT) excl Other Income",
          "val1": "106.24",
          "val2": "92.92",
          "chgp": "14.33%",
          "chgp_class": "positive"
        },
        {
          "field": "Interest",
          "val1": "2.27",
          "val2": "2.35",
          "chgp": "-3.40%",
          "chgp_class": "positive"
        },
        {
          "field": "Exceptional Items",
          "val1": "-14.78",
          "val2": "0.00",
          "chgp": "",
          "chgp_class": "neutral"
        },
        {
          "field": "Consolidate Net Profit",
          "val1": "67.54",
          "val2": "75.26",
          "chgp": "-10.26%",
          "chgp_class": "negative"
        },
        {
          "field": "Operating Profit Margin (Excl OI)",
          "val1": "16.02%",
          "val2": "15.23%",
          "chgp": "0.79%",
          "chgp_class": "positive"
        }
      ]
    }
  },
  {
    "link": "nine-monthly",
    "btn_text": "All Nine Monthly Results",
    "header": "Nine Monthly Results Snapshot (Consolidated) - Dec'25",
    "rhs": [
      {
        "prefix": "Net Sales ",
        "suffix": "YoY Growth in nine months ended Dec 2025 is 7.77% vs 17.89% in Dec 2024",
        "dir": -1
      },
      {
        "prefix": "Consolidated Net Profit ",
        "suffix": "YoY Growth in nine months ended Dec 2025 is -7.10% vs 307.71% in Dec 2024",
        "dir": -1
      }
    ],
    "table": {
      "header": [
        "Dec'25",
        "Dec'24",
        "Change(%)"
      ],
      "body": [
        {
          "field": "Net Sales",
          "val1": "933.82",
          "val2": "866.47",
          "chgp": "7.77%",
          "chgp_class": "positive"
        },
        {
          "field": "Operating Profit (PBDIT) excl Other Income",
          "val1": "149.01",
          "val2": "134.69",
          "chgp": "10.63%",
          "chgp_class": "positive"
        },
        {
          "field": "Interest",
          "val1": "3.66",
          "val2": "3.51",
          "chgp": "4.27%",
          "chgp_class": "negative"
        },
        {
          "field": "Exceptional Items",
          "val1": "-13.29",
          "val2": "0.00",
          "chgp": "",
          "chgp_class": "neutral"
        },
        {
          "field": "Consolidate Net Profit",
          "val1": "107.57",
          "val2": "115.79",
          "chgp": "-7.10%",
          "chgp_class": "negative"
        },
        {
          "field": "Operating Profit Margin (Excl OI)",
          "val1": "15.96%",
          "val2": "15.54%",
          "chgp": "0.42%",
          "chgp_class": "positive"
        }
      ]
    }
  },
  {
    "link": "annual",
    "btn_text": "All Annual Results",
    "header": "Annual Results Snapshot (Consolidated) - Mar'26",
    "rhs": [
      {
        "prefix": "Net Sales ",
        "suffix": "YoY Growth in year ended Mar 2026 is 5.87% vs 12.29% in Mar 2025",
        "dir": -1
      },
      {
        "prefix": "Consolidated Net Profit ",
        "suffix": "YoY Growth in year ended Mar 2026 is 3.41% vs 47.54% in Mar 2025",
        "dir": -1
      }
    ],
    "table": {
      "header": [
        "Mar'26",
        "Mar'25",
        "Change(%)"
      ],
      "body": [
        {
          "field": "Net Sales",
          "val1": "1,241.84",
          "val2": "1,173.00",
          "chgp": "5.87%",
          "chgp_class": "positive"
        },
        {
          "field": "Operating Profit (PBDIT) excl Other Income",
          "val1": "199.12",
          "val2": "174.88",
          "chgp": "13.86%",
          "chgp_class": "positive"
        },
        {
          "field": "Interest",
          "val1": "4.59",
          "val2": "4.72",
          "chgp": "-2.75%",
          "chgp_class": "positive"
        },
        {
          "field": "Exceptional Items",
          "val1": "-18.82",
          "val2": "0.00",
          "chgp": "",
          "chgp_class": "neutral"
        },
        {
          "field": "Consolidate Net Profit",
          "val1": "145.72",
          "val2": "140.92",
          "chgp": "3.41%",
          "chgp_class": "positive"
        },
        {
          "field": "Operating Profit Margin (Excl OI)",
          "val1": "16.03%",
          "val2": "14.91%",
          "chgp": "1.12%",
          "chgp_class": "positive"
        }
      ]
    }
  }
]

Quarterly Results Snapshot (Consolidated) - Jun'26 - YoYstock-summary

Jun'26
Jun'25
Change(%)
Net Sales
338.16
377.40
-10.40%
Operating Profit (PBDIT) excl Other Income
50.77
73.17
-30.61%
Interest
1.02
1.18
-13.56%
Exceptional Items
0.00
-14.78
100.00%
Consolidate Net Profit
37.23
39.66
-6.13%
Operating Profit Margin (Excl OI)
15.01%
19.39%
-4.38%
Values in Rs Cr.
Direction Arrows
Net Sales

YoY Growth in quarter ended Jun 2026 is -10.40% vs 33.73% in Jun 2025

Direction Arrows
Consolidated Net Profit

YoY Growth in quarter ended Jun 2026 is -6.13% vs -8.02% in Jun 2025

Half Yearly Results Snapshot (Consolidated) - Sep'25stock-summary

Sep'25
Sep'24
Change(%)
Net Sales
663.36
610.07
8.74%
Operating Profit (PBDIT) excl Other Income
106.24
92.92
14.33%
Interest
2.27
2.35
-3.40%
Exceptional Items
-14.78
0.00
Consolidate Net Profit
67.54
75.26
-10.26%
Operating Profit Margin (Excl OI)
16.02%
15.23%
0.79%
Values in Rs Cr.
Direction Arrows
Net Sales

Growth in half year ended Sep 2025 is 8.74% vs 21.51% in Sep 2024

Direction Arrows
Consolidated Net Profit

Growth in half year ended Sep 2025 is -10.26% vs 474.94% in Sep 2024

Nine Monthly Results Snapshot (Consolidated) - Dec'25stock-summary

Dec'25
Dec'24
Change(%)
Net Sales
933.82
866.47
7.77%
Operating Profit (PBDIT) excl Other Income
149.01
134.69
10.63%
Interest
3.66
3.51
4.27%
Exceptional Items
-13.29
0.00
Consolidate Net Profit
107.57
115.79
-7.10%
Operating Profit Margin (Excl OI)
15.96%
15.54%
0.42%
Values in Rs Cr.
Direction Arrows
Net Sales

YoY Growth in nine months ended Dec 2025 is 7.77% vs 17.89% in Dec 2024

Direction Arrows
Consolidated Net Profit

YoY Growth in nine months ended Dec 2025 is -7.10% vs 307.71% in Dec 2024

Annual Results Snapshot (Consolidated) - Mar'26stock-summary

Mar'26
Mar'25
Change(%)
Net Sales
1,241.84
1,173.00
5.87%
Operating Profit (PBDIT) excl Other Income
199.12
174.88
13.86%
Interest
4.59
4.72
-2.75%
Exceptional Items
-18.82
0.00
Consolidate Net Profit
145.72
140.92
3.41%
Operating Profit Margin (Excl OI)
16.03%
14.91%
1.12%
Values in Rs Cr.
Direction Arrows
Net Sales

YoY Growth in year ended Mar 2026 is 5.87% vs 12.29% in Mar 2025

Direction Arrows
Consolidated Net Profit

YoY Growth in year ended Mar 2026 is 3.41% vs 47.54% in Mar 2025

stock-summaryCompany CV
About Bharat Rasayan Ltd stock-summary
stock-summary
Bharat Rasayan Ltd
Small Cap
Pesticides & Agrochemicals
Bharat Rasayan Limited was incorporated as Public Limited Company on May 15, 1989 for the business of manufacturing the Pesticides. The Company manufacture Technical Formulation and Intermediates. Promoted by S N Gupta and Bharat Insecticides, it manufacture own technical grade pesticides, including Metaphenoxy Benzaldehyde, Fenvalerate, Cypermethrin, Ethyl Ester and Isoproturon.
Company Coordinates stock-summary
Company Details
1501 Vikram Tower, Rajendra Place New Delhi New Delhi : 110008
stock-summary
Tel: 91-11-41538383/43661111
stock-summary
invester.brl@bharatgroup.co.in
Registrar Details
Link Intime India Pvt Ltd., Narang Tower 44, Community Centre, Naraina Industrial Area , Phase - 1, New Delhi