


Key Events This Week
Jun 1: MarketsMOJO upgrades Bharat Rasayan Ltd to Hold on improved financials and valuation
Jun 1: Valuation metrics shift to 'very attractive' signalling renewed price appeal
Jun 5: Week closes at Rs.1,421.35, down 1.96% for the week
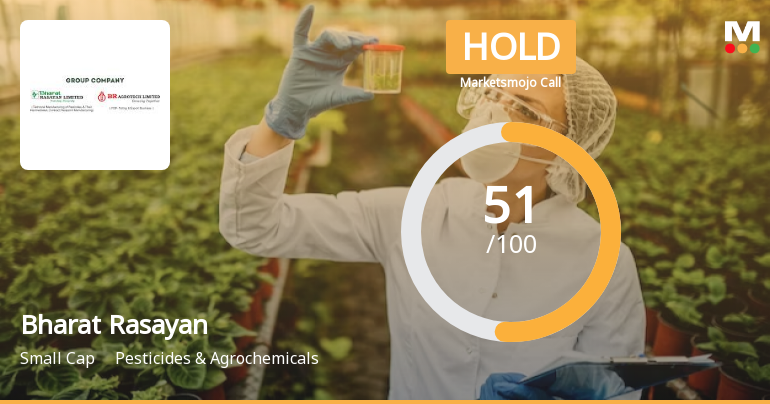
Bharat Rasayan Ltd is Rated Hold by MarketsMOJO
2026-06-12 10:10:57Bharat Rasayan Ltd is rated 'Hold' by MarketsMOJO, with this rating last updated on 29 May 2026. However, the analysis and financial metrics discussed here reflect the company’s current position as of 12 June 2026, providing investors with an up-to-date view of its fundamentals, returns, and overall outlook.
Read full news article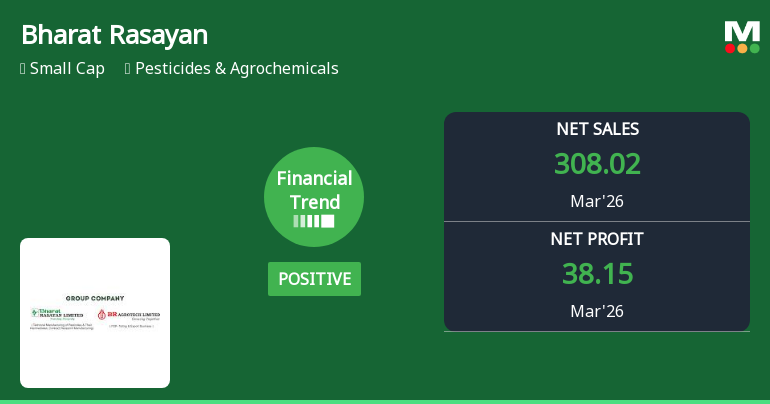
Bharat Rasayan Ltd Reports Mixed Financial Trend Amidst Strong Quarterly Growth
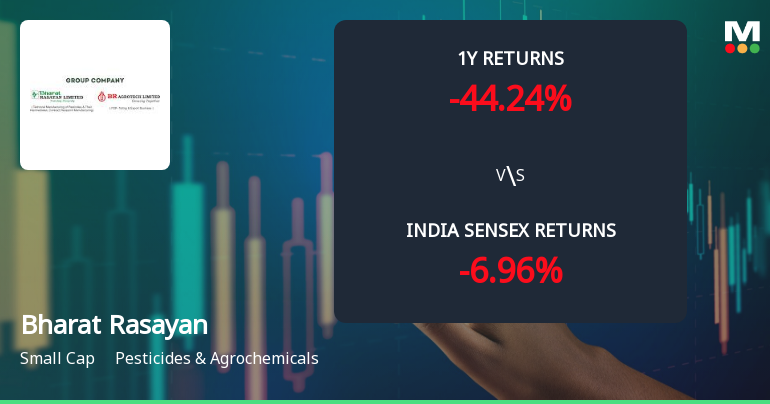
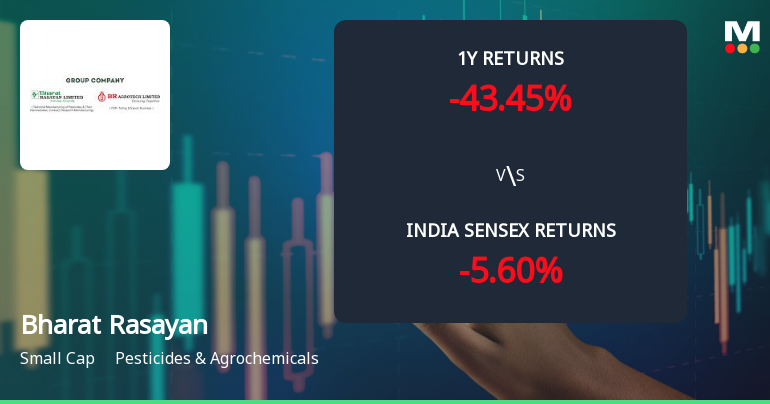
2026-06-10 15:00:11Bharat Rasayan Ltd, a key player in the Pesticides & Agrochemicals sector, reported its quarterly results for March 2026, revealing a shift from a previously positive financial trend to a flat outlook. Despite robust profit growth, the company’s stock performance continues to lag behind broader market indices, raising questions about its near-term prospects.
Read full news article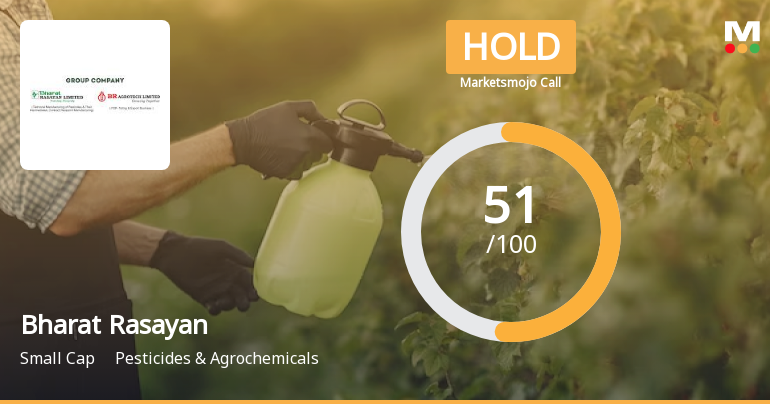
Bharat Rasayan Ltd Upgraded to Hold by MarketsMOJO on Improved Financials and Valuation
2026-06-01 08:12:13Bharat Rasayan Ltd, a small-cap player in the Pesticides & Agrochemicals sector, has seen its investment rating upgraded from Sell to Hold as of 29 May 2026. This change reflects significant improvements across financial performance, valuation metrics, and technical indicators, signalling a cautious but positive outlook for investors amid a challenging market backdrop.
Read full news article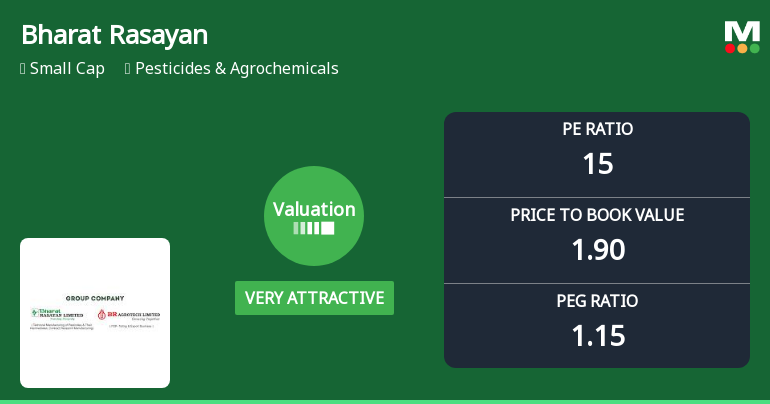
Bharat Rasayan Ltd Valuation Shifts Signal Renewed Price Attractiveness
2026-06-01 08:01:20Bharat Rasayan Ltd has witnessed a significant improvement in its valuation parameters, shifting from an attractive to a very attractive rating. This change reflects a more compelling price proposition for investors amid a challenging market backdrop and relative to its industry peers.
Read full news article


