
Compare Devyani Intl. with Similar Stocks
Dashboard
Weak Long Term Fundamental Strength with a -6.04% CAGR growth in Operating Profits over the last 5 years
- Low ability to service debt as the company has a high Debt to EBITDA ratio of 4.51 times
- The company has been able to generate a Return on Capital Employed (avg) of 8.64% signifying low profitability per unit of total capital (equity and debt)
Flat results in Mar 26
With ROCE of 4, it has a Expensive valuation with a 3.6 Enterprise value to Capital Employed
Consistent Underperformance against the benchmark over the last 3 years
Stock DNA
Leisure Services
INR 14,154 Cr (Small Cap)
NA (Loss Making)
43
0.00%
2.17
-1.11%
9.31
Total Returns (Price + Dividend) 
Devyani Intl. for the last several years.
Risk Adjusted Returns v/s
Returns Beta

News

Devyani International Ltd is Rated Strong Sell
Devyani International Ltd is rated Strong Sell by MarketsMOJO, with this rating last updated on 07 Nov 2025. However, the analysis and financial metrics discussed here reflect the company’s current position as of 24 June 2026, providing investors with the latest insights into its performance and outlook.
Read full news article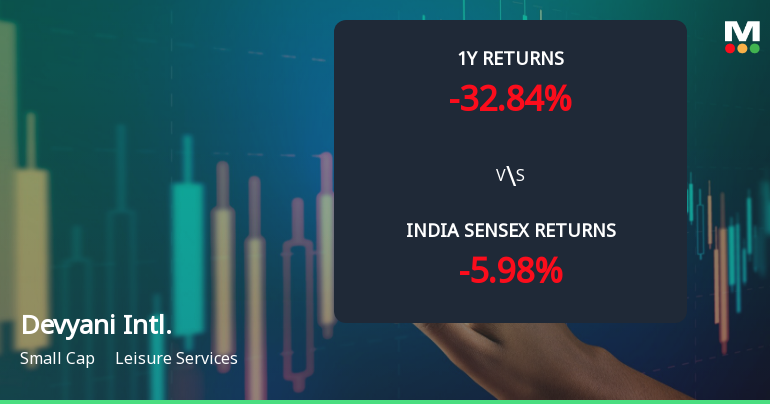
Devyani International Ltd Technical Momentum Shifts Amid Bearish Sentiment
Devyani International Ltd, a small-cap player in the Leisure Services sector, has experienced a nuanced shift in its technical momentum, reflecting a complex interplay of bullish and bearish signals across multiple timeframes. Despite a modest daily price gain of 1.64%, the stock remains under pressure with a Strong Sell mojo grade, underscoring the challenges ahead for investors.
Read full news article
Devyani International Ltd is Rated Strong Sell
Devyani International Ltd is rated Strong Sell by MarketsMOJO, with this rating last updated on 07 Nov 2025. However, the analysis and financial metrics discussed here reflect the company’s current position as of 13 June 2026, providing investors with an up-to-date perspective on the stock’s fundamentals, valuation, financial trends, and technical outlook.
Read full news article Announcements
Announcement under Regulation 30 (LODR)-Analyst / Investor Meet - Intimation
16-Jun-2026 | Source : BSEParticipation of Representatives of the Company in Event(s)/ Conference(s)
Announcement under Regulation 30 (LODR)-Scheme of Arrangement
15-Jun-2026 | Source : BSEUpdate on Scheme of Arrangement
Disclosures under Reg. 29(2) of SEBI (SAST) Regulations 2011
15-Jun-2026 | Source : BSEThe Exchange has received the disclosure under Regulation 29(2) of SEBI (Substantial Acquisition of Shares & Takeovers) Regulations 2011 for Nippon India Mutual Fund
Corporate Actions

No Upcoming Board Meetings

No Dividend history available

No Splits history available

No Bonus history available

No Rights history available
Quality key factors
Valuation key factors
Technicals key factors
 Technical Indicator Scale: Bearish, Mildly Bearish, Sideways, Mildly Bullish, Bullish Turned
 Shareholding Snapshot : Mar 2026
Shareholding Compare (%holding)
Promoters
0.0005
Held by 25 Schemes (15.36%)
Held by 109 FIIs (6.13%)
Rj Corp Limited (57.98%)
Nippon Life India Trustee Ltd- A/c Nippon India Gr (6.35%)
5.3%
Quarterly Results Snapshot (Consolidated) - Mar'26 - QoQ

QoQ Growth in quarter ended Mar 2026 is -0.28% vs 4.66% in Dec 2025
QoQ Growth in quarter ended Mar 2026 is 3.37% vs 52.54% in Dec 2025
Half Yearly Results Snapshot (Consolidated) - Sep'25
Growth in half year ended Sep 2025 is 11.85% vs 46.69% in Sep 2024
Growth in half year ended Sep 2025 is -174.65% vs -45.95% in Sep 2024
Nine Monthly Results Snapshot (Consolidated) - Dec'25
YoY Growth in nine months ended Dec 2025 is 11.67% vs 48.99% in Dec 2024
YoY Growth in nine months ended Dec 2025 is -219.67% vs -56.35% in Dec 2024
Annual Results Snapshot (Consolidated) - Mar'26
YoY Growth in year ended Mar 2026 is 13.34% vs 39.22% in Mar 2025
YoY Growth in year ended Mar 2026 is -522.19% vs -80.64% in Mar 2025
About Devyani International Ltd

Company Coordinates


