
 Price Point
Compare Dhampur Bio with Similar Stocks
ScoreDashboard
Weak Long Term Fundamental Strength with a -17.79% CAGR growth in Operating Profits over the last 5 years
- Low ability to service debt as the company has a high Debt to EBITDA ratio of 8.60 times
- The company has been able to generate a Return on Equity (avg) of 2.99% signifying low profitability per unit of shareholders funds
Flat results in Jun 26
Despite the size of the company, domestic mutual funds hold only 0% of the company


 Total Returns
Total Returns (Price + Dividend) 
Latest dividend: 1.4999999999999998 per share ex-dividend date: Jul-17-2026
Risk Adjusted Returns v/s
Returns Beta
 News & Corporate Actions
News
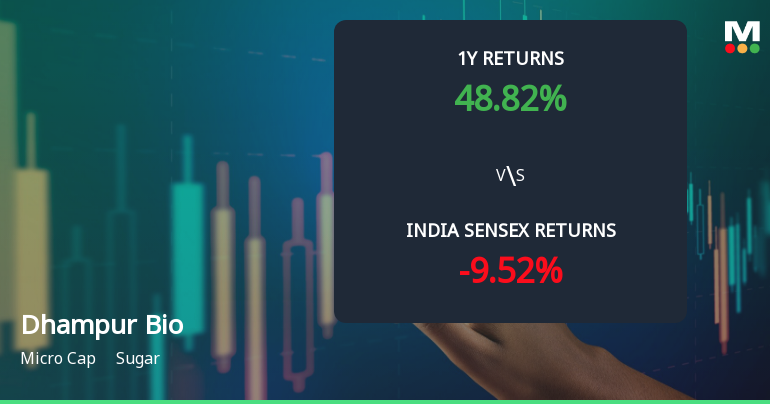
Dhampur Bio Organics Ltd Technical Momentum Shifts Signal Bullish Outlook
Dhampur Bio Organics Ltd has experienced a notable shift in its technical momentum, moving from a mildly bullish to a bullish trend, supported by a combination of moving averages, MACD, and Bollinger Bands signals. Despite a micro-cap market cap grade and a recent downgrade from Hold to Sell by MarketsMOJO, the stock’s price action and technical indicators suggest a cautiously optimistic outlook for investors navigating the sugar sector.
Read full news article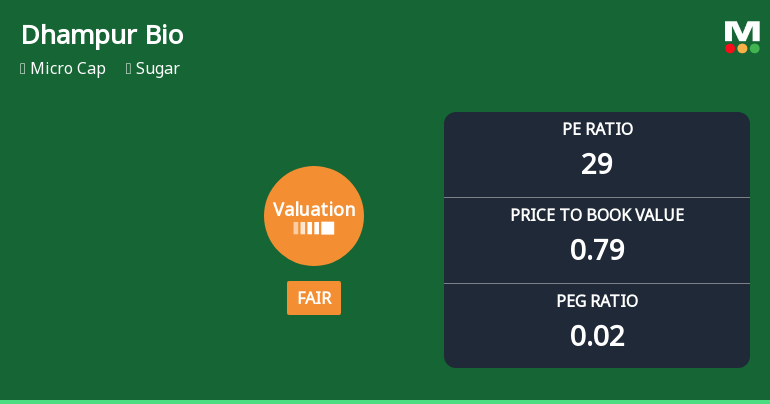
Dhampur Bio Organics Ltd Valuation Shifts Signal Changing Market Sentiment
Dhampur Bio Organics Ltd has experienced a notable shift in its valuation parameters, moving from an attractive to a fair rating. This change reflects evolving market perceptions amid fluctuating sector fundamentals and peer comparisons, prompting a reassessment of its price attractiveness for investors.
Read full news article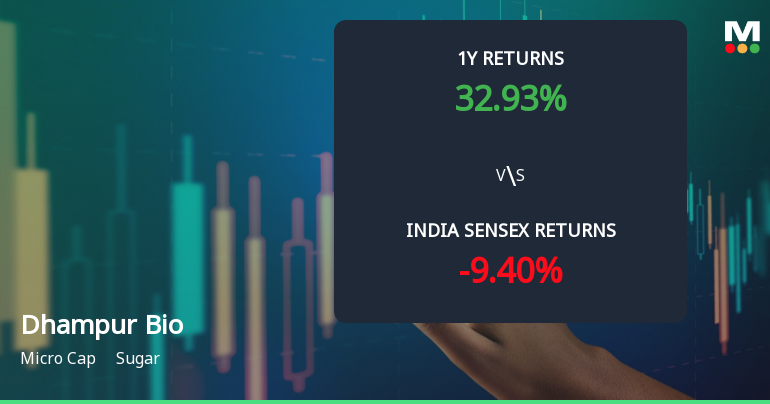
Dhampur Bio Organics Ltd Faces Mixed Technical Signals Amid Price Momentum Shift
Dhampur Bio Organics Ltd, a micro-cap player in the sugar sector, has experienced a notable shift in its technical momentum, reflecting a complex interplay of bullish and bearish signals across key indicators. The company’s stock price has declined by 2.91% on the day, closing at ₹113.55, down from the previous close of ₹116.95, signalling a cautious market stance despite a strong year-to-date return of 43.43%.
Read full news article Announcements
Closure of Trading Window
26-Sep-2026 | Source : BSEThis is to inform that pursuant to SEBI (PIT) Regulations 2015 read with the Companys Code of Conduct the trading window for dealing in shares of the Company is closed with effect from October 01 2026 till 48 hours after the declaration of financial results of the Company for the Quater and half year ended September 30 2026.
Disclosures under Reg. 29(2) of SEBI (SAST) Regulations 2011
25-Sep-2026 | Source : BSEThe Exchange has received the disclosure under Regulation 29(2) of SEBI (Substantial Acquisition of Shares & Takeovers) Regulations 2011 for Sonitron Ltd
Disclosures under Reg. 29(2) of SEBI (SAST) Regulations 2011
25-Sep-2026 | Source : BSEThe Exchange has received the disclosure under Regulation 29(2) of SEBI (Substantial Acquisition of Shares & Takeovers) Regulations 2011 for Sonitron Ltd
Corporate Actions

No Upcoming Board Meetings

Dhampur Bio Organics Ltd has declared 15% dividend, ex-date: 17 Jul 26

No Splits history available

No Bonus history available

No Rights history available
Key FactorsQuality key factors
Valuation key factors
Technicals key factors
 Technical Indicator Scale: Bearish, Mildly Bearish, Sideways, Mildly Bullish, Bullish Turned Shareholding
Shareholding Snapshot : Jun 2026
Shareholding Compare (%holding)
Promoters
None
Held by 3 Schemes (0.0%)
Held by 9 FIIs (0.29%)
Sonitron Limited (17.28%)
Anil Kumar Goel (9.04%)
36.44%
FinancialQuarterly Results Snapshot (Consolidated) - Jun'26 - QoQ
 Compare with Peers
QoQ Growth in quarter ended Jun 2026 is 15.96% vs -5.51% in Mar 2026

QoQ Growth in quarter ended Jun 2026 is -20.49% vs 173.79% in Mar 2026

Half Yearly Results Snapshot (Consolidated) - Sep'25
Growth in half year ended Sep 2025 is 16.10% vs -16.81% in Sep 2024
Growth in half year ended Sep 2025 is -63.40% vs -282.78% in Sep 2024
Nine Monthly Results Snapshot (Consolidated) - Dec'25
YoY Growth in nine months ended Dec 2025 is 12.33% vs -0.30% in Dec 2024
YoY Growth in nine months ended Dec 2025 is 29.96% vs -525.28% in Dec 2024
Annual Results Snapshot (Consolidated) - Mar'26
YoY Growth in year ended Mar 2026 is 5.13% vs -0.16% in Mar 2025
YoY Growth in year ended Mar 2026 is 71.41% vs -68.40% in Mar 2025
 Company CV
About Dhampur Bio Organics Ltd

Company Coordinates








