Magadh Sugar

INR
554.75
-12.05 (-2.13%)
BSENSE

Sep 04, 10:01 AM

BSE+NSE Vol: 4.06 k

  • Price Points
  • Score
  • Mojo Parameters
  • Total Return
  • News and Corporate Actions
  • Key factors
  • Shareholding
  • Financials
  • CompanyCV
stock-summaryPrice Point
High/Low

1Day

52 Week

Valuation
Technical
Day's Volume

CASH

4.06 k (-70.64%) Volume

Shareholding (Jun 2026)

FII

0.06%

Held by 5 FIIs

DII

0.01%

Held by 0 DIIs

Promoter

61.02%

Why is Magadh Sugar & Energy Ltd falling/rising?

04-Sep-2026

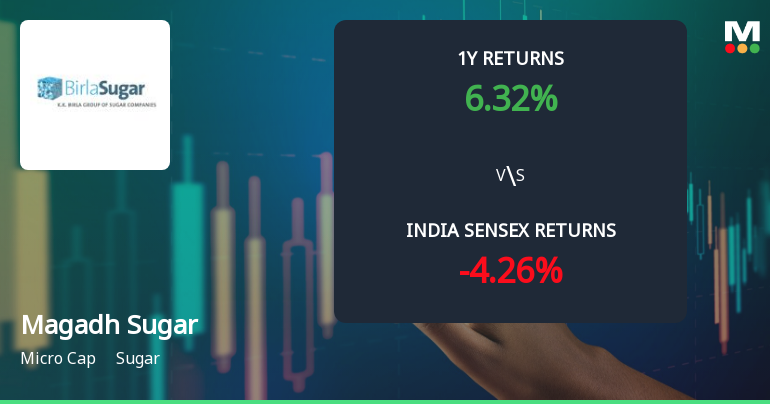
As of 03-Sep, Magadh Sugar & Energy Ltd's stock price is at 566.80, down 0.72%. Despite today's decline, the stock has shown positive trends over the past week and month, with increased investor interest indicated by a significant rise in delivery volume.

As of 03-Sep, Magadh Sugar & Energy Ltd's stock price is currently at 566.80, reflecting a decrease of 4.1 points or 0.72%. Despite this decline, the stock has shown positive performance over various time frames, including a 2.67% increase over the past week and a 5.57% increase over the past month, both outperforming the benchmark Sensex, which has seen declines of 1.01% and 3.16%, respectively. <BR><BR>However, today's performance indicates that the stock has underperformed its sector by 3.19%. While the stock is trading above its 20-day, 50-day, 100-day, and 200-day moving averages, it is below its 5-day moving average, suggesting some short-term weakness. Additionally, there has been a notable increase in investor participation, with delivery volume rising by 64.22% compared to the 5-day average, indicating growing interest in the stock despite its current price drop. <BR><BR>Overall, while the stock has experienced a slight decline today, its recent positive performance over longer periods and increased investor activity may suggest underlying strength that could support future price movements.

View full answer

Who are in the management team of Magadh Sugar?

01-Sep-2026

The management team of Magadh Sugar includes Chairperson Chandra Shekhar Nopany, along with several independent directors: Padam Kumar Khaitan, Yashwant Daga, Ishwari Prosad Singh Roy, Raj Kumar Bagri, and Shashi Sharma, as well as Whole-time Director Chandra Mohan and Company Secretary S Subramanian. They oversee the company's operations and strategic direction.

The management team of Magadh Sugar includes the following individuals:<BR><BR>1. **Chandra Shekhar Nopany** - Chairperson<BR>2. **Padam Kumar Khaitan** - Independent Director<BR>3. **Yashwant Daga** - Independent Director<BR>4. **Ishwari Prosad Singh Roy** - Independent Director<BR>5. **Raj Kumar Bagri** - Independent Director<BR>6. **Chandra Mohan** - Whole-time Director<BR>7. **Shashi Sharma** - Independent Director<BR>8. **S Subramanian** - Company Secretary & Compliance Officer<BR><BR>This team is responsible for overseeing the operations and strategic direction of the company.

View full answer

What does Magadh Sugar do?

01-Sep-2026

Magadh Sugar and Energy Ltd is a micro-cap company in India's private sugar sector, operating three mills in Bihar. As of June 2026, it reported net sales of ₹311 Cr and a net loss of ₹12 Cr, with a market cap of ₹813 Cr.

Overview: <BR>Magadh Sugar and Energy Ltd is a leading player in India's private sugar sector, categorized as a micro-cap company.<BR><BR>History: <BR>The company was established on 19 March, 2015, and operates three sugar mills in Bihar. The latest quarterly results reported net sales and profit for June 2026.<BR><BR>Financial Snapshot: <BR>Most recent Net Sales: 311 Cr (Quarterly Results - Jun 2026) <BR>Most recent Net Profit: -12 Cr (Quarterly Results - Jun 2026) <BR>Market-cap value: INR 813 Cr (Micro Cap) <BR><BR>Key Metrics: <BR>P/E: 16.00 <BR>Industry P/E: 23 <BR>Dividend Yield: 2.14% <BR>Debt-Equity: 0.78 <BR>Return on Equity: 5.87% <BR>Price to Book: 0.94 <BR><BR>Contact Details: <BR>Address: P O Hargaon, Sitapur, Uttar Pradesh: 261121 <BR>Phone: 91-5862-256220 <BR>Email: birlasugar@birla-sugar.com <BR>Website: http://www.magadhsugar.com

View full answer

Who are the peers of the Magadh Sugar?

01-Sep-2026

Magadh Sugar's peers include Dhampur Sugar, Dwarikesh Sugar, Dhampur Bio, Zuari Industries, Ugar Sugar Works, Mawana Sugars, DCM Shriram Inds, KCP Sugar & Inds., and Davangere Sugar. In terms of returns, Dhampur Bio leads with 50.33% over one year, while Magadh Sugar has an 8.74% return, higher than Davangere Sugar's -40.40%.

Peers: The peers of Magadh Sugar are Dhampur Sugar, Dwarikesh Sugar, Dhampur Bio, Zuari Industries, Ugar Sugar Works, Mawana Sugars, DCM Shriram Inds, KCP Sugar & Inds., and Davangere Sugar.<BR><BR>Quality Snapshot: Average management risk is observed at Dhampur Sugar, Dwarikesh Sugar, Dhampur Bio, Ugar Sugar Works, Mawana Sugars, DCM Shriram Inds, KCP Sugar & Inds., and Magadh Sugar, while Below Average management risk is found at Zuari Industries and Davangere Sugar. Growth is rated as Excellent at M.V.K. Agro, Below Average at Dhampur Sugar, Dwarikesh Sugar, Dhampur Bio, Zuari Industries, Magadh Sugar, Ugar Sugar Works, Mawana Sugars, KCP Sugar & Inds., and Davangere Sugar, and Average at DCM Shriram Inds. Capital Structure is rated as Below Average for Dhampur Sugar, Dhampur Bio, Zuari Industries, Magadh Sugar, Ugar Sugar Works, KCP Sugar & Inds., and Davangere Sugar, while Average is noted for Dwarikesh Sugar and DCM Shriram Inds.<BR><BR>Return Snapshot: The peer with the highest 1-year return is Dhampur Bio at 50.33%, while Davangere Sugar has the lowest at -40.40%. Magadh Sugar's 1-year return of 8.74% is significantly lower than that of Dhampur Bio but higher than Davangere Sugar. Additionally, Davangere Sugar is the only peer with a negative six-month return.

View full answer

How big is Magadh Sugar?

01-Sep-2026

As of 31st August, Magadh Sugar & Energy Ltd has a market capitalization of 813.00 Cr, with recent net sales of 287.23 Cr and a net profit of 26.20 Cr. The company's shareholder's funds are 880.19 Cr, and total assets amount to 1,679.91 Cr.

As of 31st August, Magadh Sugar & Energy Ltd has a market capitalization of 813.00 Cr, which classifies it as a Micro Cap company.<BR><BR>In the latest four quarters, the company reported Net Sales of 287.23 Cr and a Net Profit of 26.20 Cr.<BR><BR>The latest annual period for the balance sheet is March 2026, showing Shareholder's Funds of 880.19 Cr and Total Assets of 1,679.91 Cr.

View full answer

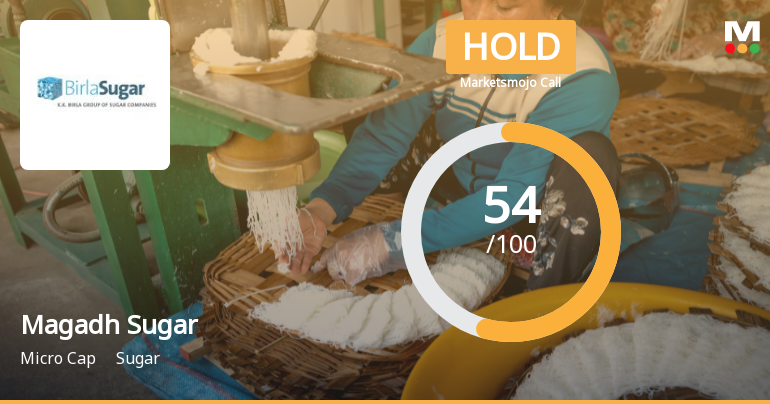
Should I buy, sell or hold Magadh Sugar & Energy Ltd?

01-Sep-2026

When is the next results date for Magadh Sugar & Energy Ltd?

28-Jul-2026

The next results date for Magadh Sugar & Energy Ltd is August 4, 2026.

The next results date for Magadh Sugar & Energy Ltd is scheduled for August 4, 2026.

View full answer

Are Magadh Sugar & Energy Ltd latest results good or bad?

07-Feb-2026

Magadh Sugar & Energy Ltd's latest results show mixed performance: while net profit for Q3 FY26 increased by 23.90% and FY25 net sales grew by 20.60%, operating margins have contracted and net profit for FY25 declined by 6.03%, indicating challenges in profitability. Overall, the results suggest caution for investors due to declining margins and modest return on equity.

Magadh Sugar & Energy Ltd's latest results present a mixed picture. On one hand, the company reported a net profit of ₹26.21 crore for Q3 FY26, which is a positive year-on-year increase of 23.90%. This indicates some improvement in profitability compared to the previous year. Additionally, the net sales for FY25 grew robustly by 20.60% to ₹1,322 crore, reflecting strong demand in the sugar sector.<BR><BR>However, there are significant concerns regarding profitability metrics. The operating margin has contracted to 15.90%, down from 19.40% in FY24, indicating mounting cost pressures that are affecting the company's ability to convert revenue growth into profit. Furthermore, the net profit for FY25 declined by 6.03% compared to the previous year, highlighting a concerning divergence between revenue growth and bottom-line performance.<BR><BR>The company's return on equity (ROE) stands at 10.24%, which is relatively modest and raises questions about its efficiency in generating returns for shareholders. Additionally, the stock is currently trading below key moving averages, reflecting bearish sentiment among investors.<BR><BR>Overall, while there are some positive signs in terms of revenue growth and quarterly profit improvement, the decline in margins and net profit, along with operational challenges, suggest that the company's latest results may not be entirely favorable. Investors should consider these factors when evaluating the company's performance.

View full answer

Is Magadh Sugar technically bullish or bearish?

20-Nov-2025

As of 19 November 2025, Magadh Sugar's technical trend has shifted to a moderate bearish stance, indicated by bearish MACD, Bollinger Bands, and moving averages, despite some mixed signals from KST and OBV.

As of 19 November 2025, the technical trend for Magadh Sugar has changed from mildly bearish to bearish. The current stance is bearish with a moderate strength. Key indicators driving this include a bearish MACD on the weekly timeframe, bearish Bollinger Bands on both weekly and monthly timeframes, and bearish moving averages on the daily timeframe. The KST and OBV show mixed signals with mildly bullish readings on the weekly, but overall, the prevailing indicators suggest a bearish outlook.

View full answer

How has been the historical performance of Magadh Sugar?

17-Nov-2025

Magadh Sugar has shown consistent growth in net sales and profits, with net sales increasing from 739.16 Cr in Mar'19 to 1,322.29 Cr in Mar'25. However, rising costs have led to fluctuations in profit margins, with profit after tax decreasing from 116.41 Cr in Mar'24 to 109.45 Cr in Mar'25.

Answer:<BR>The historical performance of Magadh Sugar shows a trend of increasing net sales and profits over the years, with some fluctuations in costs and margins.<BR><BR>Breakdown:<BR>Magadh Sugar's net sales have shown a consistent upward trajectory, rising from 739.16 Cr in Mar'19 to 1,322.29 Cr in Mar'25. Total operating income followed a similar trend, reaching 1,322.29 Cr in Mar'25, up from 953.42 Cr in Mar'23. However, total expenditure also increased, amounting to 1,111.44 Cr in Mar'25, which is higher than the previous years, leading to an operating profit of 213.67 Cr in Mar'25, slightly down from 214.64 Cr in Mar'24. Profit before tax peaked at 156.59 Cr in Mar'24 but decreased to 147.78 Cr in Mar'25, while profit after tax was 109.45 Cr in Mar'25, down from 116.41 Cr in Mar'24. The company's total assets grew to 1,688.98 Cr in Mar'25, with total liabilities also increasing to 1,688.98 Cr, reflecting a rise in long-term borrowings to 228.75 Cr. The cash flow from operating activities improved significantly to 139 Cr in Mar'25, compared to 31 Cr in Mar'24, indicating better operational efficiency despite a negative cash flow from investing activities of -149 Cr. Overall, while Magadh Sugar has experienced growth in sales and profits, it faces challenges with rising costs and fluctuating profit margins.

View full answer

Is Magadh Sugar overvalued or undervalued?

14-Nov-2025

As of November 13, 2025, Magadh Sugar is considered very attractive and undervalued, with favorable valuation ratios compared to peers, despite recent underperformance against the Sensex, but it has delivered a remarkable 422.5% return over the past five years.

As of 13 November 2025, the valuation grade for Magadh Sugar has moved from attractive to very attractive, indicating a significant improvement in its perceived value. The company is currently considered undervalued. Key ratios supporting this assessment include a PE ratio of 8.56, an EV to EBITDA ratio of 5.89, and a Price to Book Value of 0.88, all of which are favorable compared to industry peers.<BR><BR>In comparison to its peers, Magadh Sugar's valuation metrics stand out, especially when contrasted with EID Parry, which has a PE ratio of 20.68 and is deemed very expensive, and Balrampur Chini, which is rated fair with a PE of 22.8. Despite recent underperformance against the Sensex, with a year-to-date return of -21.47% compared to the Sensex's 8.11%, the long-term outlook remains promising, as evidenced by a remarkable 422.5% return over the past five years.

View full answer

Who are the top shareholders of the Magadh Sugar?

17-Jul-2025

The top shareholders of Magadh Sugar include Sil Investments Limited with 11.97%, Navjeewan Medical Institute at 5.56%, and individual investors collectively holding 28.29%. Foreign institutional investors and mutual funds have minimal stakes of 0.16% and 0.01%, respectively.

The top shareholders of Magadh Sugar include a mix of promoters and public investors. The largest promoter is Sil Investments Limited, holding 11.97% of the shares. In terms of public shareholders, Navjeewan Medical Institute is the highest with a 5.56% stake. Additionally, individual investors collectively hold 28.29% of the company's shares. There are also a few foreign institutional investors (FIIs) and mutual funds involved, but their holdings are relatively small, with FIIs holding 0.16% and mutual funds at 0.01%.

View full answer

What is the bonus history of the Magadh Sugar?

06-Jun-2025

Magadh Sugar & Energy Ltd announced a 4:10 bonus issue on June 27, 2019, with a record date of June 30, 2019, meaning shareholders received 4 additional shares for every 10 shares held.

Magadh Sugar & Energy Ltd has a bonus history that includes a 4:10 bonus issue announced on June 27, 2019. The record date for this bonus was June 30, 2019. This means that for every 10 shares held, shareholders received 4 additional shares as a bonus. If you have any more questions about the company or its financials, feel free to ask!

View full answer

Has Magadh Sugar declared dividend?

06-Jun-2025

Yes, Magadh Sugar has declared a 100% dividend, amounting to ₹5 per share, with an ex-date of July 25, 2024. The current dividend yield is 2.01%, and the company has shown strong total returns across various periods, particularly in price appreciation.

Magadh Sugar has declared a 100% dividend.<BR><BR>Dividend Details:<BR>- Percentage announced: 100%<BR>- Amount per share: 5<BR>- Ex-date: 25 Jul 24<BR><BR>Dividend Yield: 2.01%.<BR><BR>Total Returns by Period:<BR>In the last 6 months, the price return was 1.9%, with no dividend return, resulting in a total return of 1.9%.<BR><BR>Over the past year, the price return was 16.97%, with a dividend return of 0.73%, leading to a total return of 17.7%.<BR><BR>In the 2-year period, the price return was 107.98%, with a dividend return of 2.90%, culminating in a total return of 110.88%.<BR><BR>For the 3-year period, the price return was 118.07%, with a dividend return of 6.42%, resulting in a total return of 124.49%.<BR><BR>In the last 4 years, the price return was 247.84%, with a dividend return of 7.40%, leading to a total return of 255.24%.<BR><BR>Over the past 5 years, the price return was 603.4%, with a dividend return of 19.99%, resulting in a total return of 623.39%.<BR><BR>Overall, Magadh Sugar's recent dividend declaration and the consistent positive returns over various periods indicate a strong performance, particularly in price appreciation, while the dividend yield adds an attractive element for investors.

View full answer
iScoreScore
Click here to find our call on this stock
Strong Sell
Sell
Hold
Buy
Strong Buy

Dashboard

1

Low ability to service debt as the company has a high Debt to EBITDA ratio of 4.70 times

  • Low ability to service debt as the company has a high Debt to EBITDA ratio of 4.70 times
2

Poor long term growth as Net Sales has grown by an annual rate of 3.84% and Operating profit at 2.24% over the last 5 years

 
3

With a fall in Net Sales of -6.76%, the company declared Very Negative results in Jun 26

4

With ROCE of 7.5, it has a Attractive valuation with a 0.9 Enterprise value to Capital Employed

5

Despite the size of the company, domestic mutual funds hold only 0.02% of the company

stock-summaryMojo Parameters

Mojo Parameters

Loading Valuation Snapshot...

Stock DNA

stock-summary
Industry

Sugar

stock-summary
Market cap

INR 793 Cr (Micro Cap)

stock-summary
P/E

15.00

stock-summary
Industry P/E

23

stock-summary
Dividend Yield

2.22%

stock-summary
Debt Equity

0.78

stock-summary
Return on Equity

5.87%

stock-summary
Price to Book

0.90

Revenue and Profits:
Net Sales:
311 Cr
(Quarterly Results - Jun 2026)
Net Profit:
-12 Cr
stock-summaryTotal Returns
Total Returns (Price + Dividend) stock-summary
Dividend Yield (2.22%)
TimePeriod
Price Return
Dividend Return
Total Return
3 Months
22.38%
2.80%
25.18%
6 Months
17.76%
2.77%
20.53%
1 Year
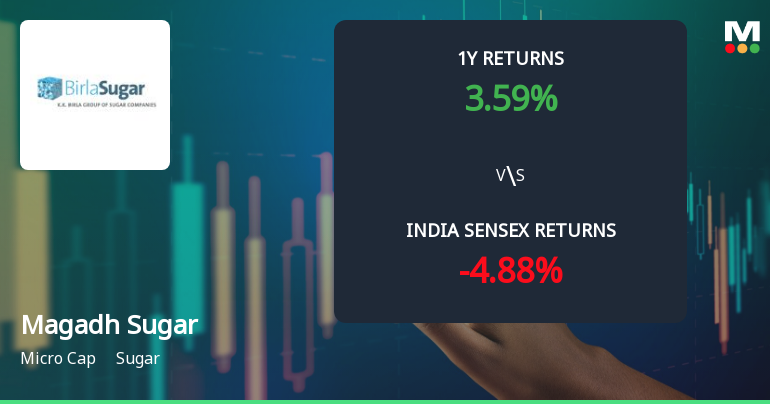
-2.53%
2.21%
-0.32%
2 Years
-38.0%
2.87%
-35.13%
3 Years
-10.8%
4.23%
-6.57%
4 Years
87.45%
12.69%
100.14%
5 Years
98.16%
14.71%
112.87%

Latest dividend: 12.5 per share ex-dividend date: Jul-17-2026

Risk Adjusted Returns v/s stock-summary
Returns Beta
Icon
Beta has not been calculated since enough price history is not available
stock-summaryNews & Corporate Actions

News

Announcements stock-summary

Announcement under Regulation 30 (LODR)-Newspaper Publication

26-Aug-2026 | Source : BSE

Copy of Newspaper Publication

Announcement under Regulation 30 (LODR)-Newspaper Publication

25-Aug-2026 | Source : BSE

Copy of Newspaper Publication

Shareholder Meeting / Postal Ballot-Notice of Postal Ballot

24-Aug-2026 | Source : BSE

Notice of Postal Ballot

Corporate Actions stock-summary

stock-summary
BOARD MEETING

No Upcoming Board Meetings

stock-summary
DIVIDEND

Magadh Sugar & Energy Ltd has declared 125% dividend, ex-date: 17 Jul 26

stock-summary
SPLITS

No Splits history available

stock-summary
BONUS

Magadh Sugar & Energy Ltd has announced 4:10 bonus issue, ex-date: 27 Jun 19

stock-summary
RIGHTS

No Rights history available

stock-summaryKey Factors

Quality key factors stock-summary

Factor
Value
Sales Growth (5y)
3.84%
EBIT Growth (5y)
2.24%
EBIT to Interest (avg)
3.92
Debt to EBITDA (avg)
3.24
Net Debt to Equity (avg)
0.78
Sales to Capital Employed (avg)
0.96
Tax Ratio
25.64%
Dividend Payout Ratio
16.09%
Pledged Shares
0
Institutional Holding
0.07%
ROCE (avg)
11.65%
ROE (avg)
10.31%

Valuation key factors

Factor
Value
P/E Ratio
15
Industry P/E
23
Price to Book Value
0.90
EV to EBIT
15.05
EV to EBITDA
11.52
EV to Capital Employed
0.94
EV to Sales
1.21
PEG Ratio
NA
Dividend Yield
2.22%
ROCE (Latest)
7.47%
ROE (Latest)
5.87%

Technicals key factors

Indicator
Weekly
Monthly
MACD
Bullish
Mildly Bullish
RSI
No Signal
No Signal
Bollinger Bands
Mildly Bullish
Mildly Bullish
Moving Averages
Bullish (Daily)
KST
Bullish
Bearish
Dow Theory
No Trend
No Trend
OBV
No Trend
No Trend
stock-summary Technical Indicator Scale: Bearish, Mildly Bearish, Sideways, Mildly Bullish, Bullish  Turned 
stock-summaryShareholding
Shareholding Snapshot : Jun 2026stock-summary
Shareholding Compare (%holding) stock-summary
Majority shareholders

Promoters

Pledged Promoter Holdings

None

Mutual Funds

Held by 1 Schemes (0.01%)

FIIs

Held by 5 FIIs (0.06%)

Promoter with highest holding

Sil Investments Limited (11.97%)

Highest Public shareholder

Navjeewan Medical Institute (5.56%)

Individual Investors Holdings

28.43%

stock-summaryFinancial
[
  {
    "link": "quarterly",
    "btn_text": "All Quarterly Results",
    "header": "Quarterly Results Snapshot (Standalone) - Jun'26 - YoY",
    "rhs": [
      {
        "prefix": "Net Sales ",
        "suffix": "YoY Growth in quarter ended Jun 2026 is -6.76% vs -7.33% in Jun 2025",
        "dir": 1
      },
      {
        "prefix": "Standalone Net Profit ",
        "suffix": "YoY Growth in quarter ended Jun 2026 is -5,654.55% vs -98.08% in Jun 2025",
        "dir": -1
      }
    ],
    "table": {
      "header": [
        "Jun'26",
        "Jun'25",
        "Change(%)"
      ],
      "body": [
        {
          "field": "Net Sales",
          "val1": "310.54",
          "val2": "333.04",
          "chgp": "-6.76%",
          "chgp_class": "negative"
        },
        {
          "field": "Operating Profit (PBDIT) excl Other Income",
          "val1": "0.72",
          "val2": "19.08",
          "chgp": "-96.23%",
          "chgp_class": "negative"
        },
        {
          "field": "Interest",
          "val1": "9.94",
          "val2": "12.24",
          "chgp": "-18.79%",
          "chgp_class": "positive"
        },
        {
          "field": "Exceptional Items",
          "val1": "0.00",
          "val2": "0.00",
          "chgp": "",
          "chgp_class": "neutral"
        },
        {
          "field": "Standalone Net Profit",
          "val1": "-12.22",
          "val2": "0.22",
          "chgp": "-5,654.55%",
          "chgp_class": "negative"
        },
        {
          "field": "Operating Profit Margin (Excl OI)",
          "val1": "0.23%",
          "val2": "5.73%",
          "chgp": "-5.50%",
          "chgp_class": "negative"
        }
      ]
    }
  },
  {
    "link": "half-yearly",
    "btn_text": "All Half Yearly Results",
    "header": "Half Yearly Results Snapshot (Standalone) - Sep'25",
    "rhs": [
      {
        "prefix": "Net Sales ",
        "suffix": " Growth in half year ended Sep 2025 is -3.77% vs 15.82% in Sep 2024",
        "dir": -1
      },
      {
        "prefix": "Standalone Net Profit ",
        "suffix": " Growth in half year ended Sep 2025 is -160.33% vs -45.17% in Sep 2024",
        "dir": -1
      }
    ],
    "table": {
      "header": [
        "Sep'25",
        "Sep'24",
        "Change(%)"
      ],
      "body": [
        {
          "field": "Net Sales",
          "val1": "657.45",
          "val2": "683.24",
          "chgp": "-3.77%",
          "chgp_class": "negative"
        },
        {
          "field": "Operating Profit (PBDIT) excl Other Income",
          "val1": "20.88",
          "val2": "56.14",
          "chgp": "-62.81%",
          "chgp_class": "negative"
        },
        {
          "field": "Interest",
          "val1": "20.47",
          "val2": "20.57",
          "chgp": "-0.49%",
          "chgp_class": "positive"
        },
        {
          "field": "Exceptional Items",
          "val1": "0.00",
          "val2": "0.00",
          "chgp": "",
          "chgp_class": "neutral"
        },
        {
          "field": "Standalone Net Profit",
          "val1": "-10.13",
          "val2": "16.79",
          "chgp": "-160.33%",
          "chgp_class": "negative"
        },
        {
          "field": "Operating Profit Margin (Excl OI)",
          "val1": "3.18%",
          "val2": "8.22%",
          "chgp": "-5.04%",
          "chgp_class": "negative"
        }
      ]
    }
  },
  {
    "link": "nine-monthly",
    "btn_text": "All Nine Monthly Results",
    "header": "Nine Monthly Results Snapshot (Standalone) - Dec'25",
    "rhs": [
      {
        "prefix": "Net Sales ",
        "suffix": "YoY Growth in nine months ended Dec 2025 is -1.37% vs 19.62% in Dec 2024",
        "dir": -1
      },
      {
        "prefix": "Standalone Net Profit ",
        "suffix": "YoY Growth in nine months ended Dec 2025 is -60.57% vs -45.43% in Dec 2024",
        "dir": -1
      }
    ],
    "table": {
      "header": [
        "Dec'25",
        "Dec'24",
        "Change(%)"
      ],
      "body": [
        {
          "field": "Net Sales",
          "val1": "953.87",
          "val2": "967.08",
          "chgp": "-1.37%",
          "chgp_class": "negative"
        },
        {
          "field": "Operating Profit (PBDIT) excl Other Income",
          "val1": "69.14",
          "val2": "95.45",
          "chgp": "-27.56%",
          "chgp_class": "negative"
        },
        {
          "field": "Interest",
          "val1": "25.34",
          "val2": "25.71",
          "chgp": "-1.44%",
          "chgp_class": "positive"
        },
        {
          "field": "Exceptional Items",
          "val1": "-1.56",
          "val2": "0.00",
          "chgp": "",
          "chgp_class": "neutral"
        },
        {
          "field": "Standalone Net Profit",
          "val1": "14.96",
          "val2": "37.94",
          "chgp": "-60.57%",
          "chgp_class": "negative"
        },
        {
          "field": "Operating Profit Margin (Excl OI)",
          "val1": "7.25%",
          "val2": "9.87%",
          "chgp": "-2.62%",
          "chgp_class": "negative"
        }
      ]
    }
  },
  {
    "link": "annual",
    "btn_text": "All Annual Results",
    "header": "Annual Results Snapshot (Standalone) - Mar'26",
    "rhs": [
      {
        "prefix": "Net Sales ",
        "suffix": "YoY Growth in year ended Mar 2026 is -5.88% vs 20.58% in Mar 2025",
        "dir": -1
      },
      {
        "prefix": "Standalone Net Profit ",
        "suffix": "YoY Growth in year ended Mar 2026 is -41.97% vs -5.98% in Mar 2025",
        "dir": -1
      }
    ],
    "table": {
      "header": [
        "Mar'26",
        "Mar'25",
        "Change(%)"
      ],
      "body": [
        {
          "field": "Net Sales",
          "val1": "1,244.54",
          "val2": "1,322.29",
          "chgp": "-5.88%",
          "chgp_class": "negative"
        },
        {
          "field": "Operating Profit (PBDIT) excl Other Income",
          "val1": "147.09",
          "val2": "210.85",
          "chgp": "-30.24%",
          "chgp_class": "negative"
        },
        {
          "field": "Interest",
          "val1": "35.52",
          "val2": "38.46",
          "chgp": "-7.64%",
          "chgp_class": "positive"
        },
        {
          "field": "Exceptional Items",
          "val1": "-0.83",
          "val2": "0.00",
          "chgp": "",
          "chgp_class": "neutral"
        },
        {
          "field": "Standalone Net Profit",
          "val1": "63.51",
          "val2": "109.45",
          "chgp": "-41.97%",
          "chgp_class": "negative"
        },
        {
          "field": "Operating Profit Margin (Excl OI)",
          "val1": "11.82%",
          "val2": "15.95%",
          "chgp": "-4.13%",
          "chgp_class": "negative"
        }
      ]
    }
  }
]

Quarterly Results Snapshot (Standalone) - Jun'26 - YoYstock-summary

Jun'26
Jun'25
Change(%)
Net Sales
310.54
333.04
-6.76%
Operating Profit (PBDIT) excl Other Income
0.72
19.08
-96.23%
Interest
9.94
12.24
-18.79%
Exceptional Items
0.00
0.00
Standalone Net Profit
-12.22
0.22
-5,654.55%
Operating Profit Margin (Excl OI)
0.23%
5.73%
-5.50%
Values in Rs Cr.
Direction Arrows
Net Sales

YoY Growth in quarter ended Jun 2026 is -6.76% vs -7.33% in Jun 2025

Direction Arrows
Standalone Net Profit

YoY Growth in quarter ended Jun 2026 is -5,654.55% vs -98.08% in Jun 2025

Half Yearly Results Snapshot (Standalone) - Sep'25stock-summary

Sep'25
Sep'24
Change(%)
Net Sales
657.45
683.24
-3.77%
Operating Profit (PBDIT) excl Other Income
20.88
56.14
-62.81%
Interest
20.47
20.57
-0.49%
Exceptional Items
0.00
0.00
Standalone Net Profit
-10.13
16.79
-160.33%
Operating Profit Margin (Excl OI)
3.18%
8.22%
-5.04%
Values in Rs Cr.
Direction Arrows
Net Sales

Growth in half year ended Sep 2025 is -3.77% vs 15.82% in Sep 2024

Direction Arrows
Standalone Net Profit

Growth in half year ended Sep 2025 is -160.33% vs -45.17% in Sep 2024

Nine Monthly Results Snapshot (Standalone) - Dec'25stock-summary

Dec'25
Dec'24
Change(%)
Net Sales
953.87
967.08
-1.37%
Operating Profit (PBDIT) excl Other Income
69.14
95.45
-27.56%
Interest
25.34
25.71
-1.44%
Exceptional Items
-1.56
0.00
Standalone Net Profit
14.96
37.94
-60.57%
Operating Profit Margin (Excl OI)
7.25%
9.87%
-2.62%
Values in Rs Cr.
Direction Arrows
Net Sales

YoY Growth in nine months ended Dec 2025 is -1.37% vs 19.62% in Dec 2024

Direction Arrows
Standalone Net Profit

YoY Growth in nine months ended Dec 2025 is -60.57% vs -45.43% in Dec 2024

Annual Results Snapshot (Standalone) - Mar'26stock-summary

Mar'26
Mar'25
Change(%)
Net Sales
1,244.54
1,322.29
-5.88%
Operating Profit (PBDIT) excl Other Income
147.09
210.85
-30.24%
Interest
35.52
38.46
-7.64%
Exceptional Items
-0.83
0.00
Standalone Net Profit
63.51
109.45
-41.97%
Operating Profit Margin (Excl OI)
11.82%
15.95%
-4.13%
Values in Rs Cr.
Direction Arrows
Net Sales

YoY Growth in year ended Mar 2026 is -5.88% vs 20.58% in Mar 2025

Direction Arrows
Standalone Net Profit

YoY Growth in year ended Mar 2026 is -41.97% vs -5.98% in Mar 2025

stock-summaryCompany CV
About Magadh Sugar & Energy Ltd stock-summary
stock-summary
Magadh Sugar & Energy Ltd
Micro Cap
Sugar
Magadh Sugar and Energy Limited is a leading player in India's private sugar sector, which makes Company a part of the Group's network of seven efficient sugar plants in Uttar Pradesh and Bihar, with a total cane crushing capacity of 56,300 tonnes per day. The Company was established on 19 March, 2015 and operates three sugar mills in Bihar at Narkatiaganj, Sidhwalia and Hasanpur.
Company Coordinates stock-summary
Company Details
P O Hargaon , Sitapur Uttar Pradesh : 261121
stock-summary
Tel: 91-5862-256220
stock-summary
birlasugar@birla-sugar.com
Registrar Details
Link Intime India Pvt Ltd, 59 C , Chowringhee Road, 3rd Floor, Kolkata