
Compare Five-Star Bus.Fi with Similar Stocks
Dashboard
Strong Long Term Fundamental Strength with an average Return on Equity (ROE) of 15.47%
Healthy long term growth as Operating profit has grown by an annual rate of 27.12%
Flat results in Mar 26
With ROE of 14.9, it has a Attractive valuation with a 2 Price to Book Value
High Institutional Holdings at 66.05%
Consistent Underperformance against the benchmark over the last 3 years
Stock DNA
Non Banking Financial Company (NBFC)
INR 15,106 Cr (Small Cap)
13.00
21
0.39%
1.11
14.89%
2.07
Total Returns (Price + Dividend) 
Latest dividend: 2.007886840977282 per share ex-dividend date: Aug-14-2025
Risk Adjusted Returns v/s
Returns Beta

News

Five-Star Business Finance Ltd Surges 7.05% to Day's High of Rs 525.75 — Outperforms Sector by 6.72 Percentage Points
The Sensex edged up 0.08% on 18 Jun 2026, while Five-Star Business Finance Ltd surged 7.05%, touching an intraday high of Rs 525.75. This 6.72 percentage-point outperformance over its NBFC sector peers highlights a distinctly stock-specific rally rather than a broad market lift.
Read full news article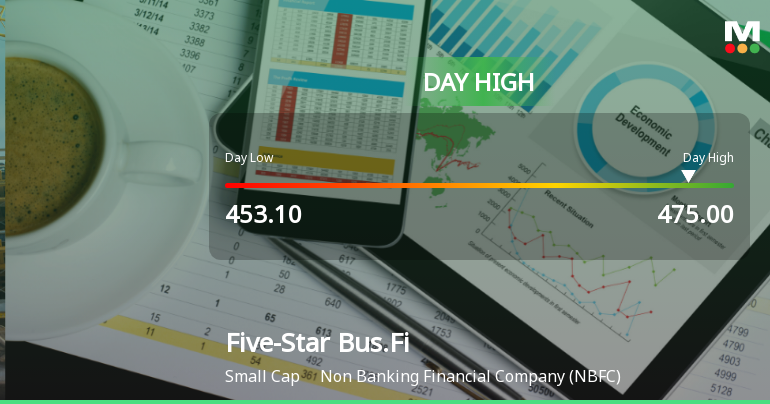
Five-Star Business Finance Ltd Surges 7.4% to Day's High of Rs 475 — Outperforms Sector by 3.1 Percentage Points
The Sensex advanced 1.49% on 15 Jun 2026, yet Five-Star Business Finance Ltd outpaced both the benchmark and its sector peers with a robust 7.4% gain, reaching an intraday peak of Rs 475. This 3.1 percentage-point outperformance over the Non Banking Financial Company (NBFC) sector signals a distinctly stock-specific momentum shift rather than a mere market tailwind.
Read full news article
Five-Star Business Finance Ltd is Rated Hold by MarketsMOJO
Five-Star Business Finance Ltd is rated 'Hold' by MarketsMOJO, with this rating last updated on 09 April 2026. However, the analysis and financial metrics discussed here reflect the stock's current position as of 15 June 2026, providing investors with an up-to-date view of the company’s fundamentals, returns, and market standing.
Read full news article Announcements
Disclosure Under Regulation 30 Of SEBI (Listing Obligations And Disclosure Requirements) Regulations 2015
20-Jun-2026 | Source : BSEDisclosure under Regulation 30 of SEBI (LODR) Regulations 2015
Announcement under Regulation 30 (LODR)-Analyst / Investor Meet - Intimation
16-Jun-2026 | Source : BSEIntimation of Schedule of Investor/Analyst meetings under the SEBI (Listing Obligations and Disclosure Requirements) Regulations 2015
Announcement under Regulation 30 (LODR)-Analyst / Investor Meet - Intimation
10-Jun-2026 | Source : BSEIntimation of Schedule of Investor/Analyst meetings under the SEBI (Listing Obligations and Disclosure Requirements) Regulations 2015
Corporate Actions

No Upcoming Board Meetings

Five-Star Business Finance Ltd has declared 200% dividend, ex-date: 31 Jul 26

No Splits history available

No Bonus history available

No Rights history available
Quality key factors
Valuation key factors
Technicals key factors
 Technical Indicator Scale: Bearish, Mildly Bearish, Sideways, Mildly Bullish, Bullish Turned
 Shareholding Snapshot : Mar 2026
Shareholding Compare (%holding)
FIIs
0.0004
Held by 21 Schemes (13.05%)
Held by 181 FIIs (48.47%)
D Lakshmipathy (10.51%)
Hdfc Mutual Fund - Hdfc Bse 500 Etf (7.48%)
10.17%
Quarterly Results Snapshot (Standalone) - Mar'26 - QoQ

QoQ Growth in quarter ended Mar 2026 is 0.23% vs 1.96% in Dec 2025

QoQ Growth in quarter ended Mar 2026 is -2.80% vs -3.18% in Dec 2025
Half Yearly Results Snapshot (Standalone) - Sep'25
Growth in half year ended Sep 2025 is 15.93% vs 36.93% in Sep 2024
Growth in half year ended Sep 2025 is 6.34% vs 35.61% in Sep 2024
Nine Monthly Results Snapshot (Standalone) - Dec'25
YoY Growth in nine months ended Dec 2025 is 14.58% vs 33.77% in Dec 2024
YoY Growth in nine months ended Dec 2025 is 4.55% vs 32.26% in Dec 2024
Annual Results Snapshot (Standalone) - Mar'26
YoY Growth in year ended Mar 2026 is 13.00% vs 30.46% in Mar 2025
YoY Growth in year ended Mar 2026 is 2.45% vs 28.30% in Mar 2025
About Five-Star Business Finance Ltd

Company Coordinates


