
Compare Capri Global with Similar Stocks
Dashboard
Strong Long Term Fundamental Strength with a 41.62% CAGR growth in Operating Profits
Healthy long term growth as Net Sales has grown by an annual rate of 45.40% and Operating profit at 41.62%
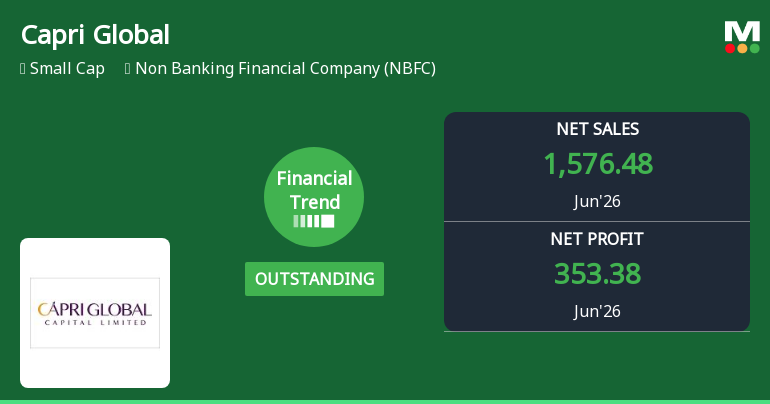
With a growth in Net Profit of 102.05%, the company declared Outstanding results in Jun 26
With ROE of 13.2, it has a Fair valuation with a 3.3 Price to Book Value
High Institutional Holdings at 26.62%
Stock DNA
Non Banking Financial Company (NBFC)
INR 22,489 Cr (Small Cap)
25.00
9
0.08%
3.35
13.18%
3.29
Total Returns (Price + Dividend) 
Latest dividend: 0.2 per share ex-dividend date: Sep-11-2025
Risk Adjusted Returns v/s
Returns Beta

News
Capri Global Capital Ltd Reports Outstanding Q1 2026 Financial Performance Amid Strong Market Returns
Capri Global Capital Ltd has delivered an exceptional quarterly performance for June 2026, marking a significant improvement in its financial trend and prompting an upgrade in its Mojo Grade to Strong Buy. The company’s revenue, profitability, and cash position have all reached record highs, reflecting robust operational execution amid a challenging NBFC sector environment.
Read full news article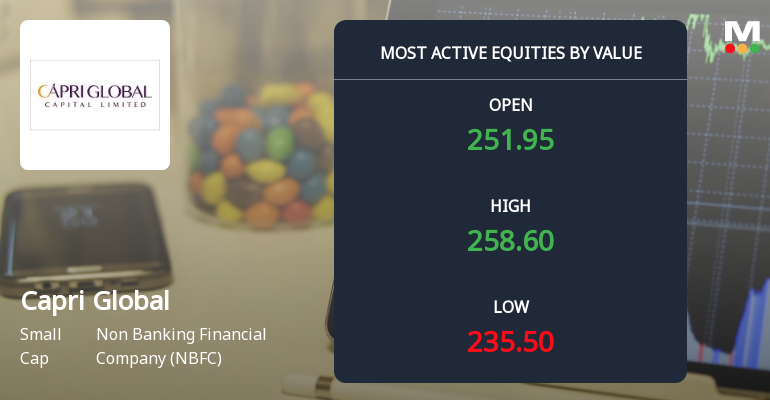
Capri Global Capital Ltd Sees High-Value Trading Amid Mixed Price Action and Strong Institutional Interest
Capri Global Capital Ltd (CGCL), a small-cap player in the Non Banking Financial Company (NBFC) sector, emerged as one of the most actively traded stocks by value on 28 Jul 2026. Despite a modest decline of 1.04% in its share price, the stock witnessed robust trading volumes and heightened investor participation, reflecting significant institutional interest and large order flows in a volatile market environment.
Read full news article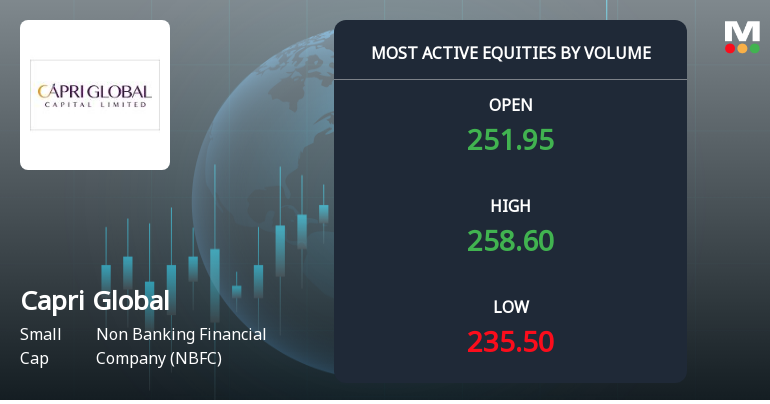
Capri Global Capital Ltd Sees Exceptional Volume Amid Mixed Price Action
Capri Global Capital Ltd (CGCL), a small-cap player in the Non Banking Financial Company (NBFC) sector, witnessed one of the highest trading volumes on 28 Jul 2026, with over 77 lakh shares changing hands. Despite a strong intraday rally, the stock closed lower, signalling a complex interplay of investor sentiment and market dynamics.
Read full news article Announcements
Capri Global Capital Limited - Corrigendum
13-Nov-2019 | Source : NSECapri Global Capital Limited has informed the Exchange regarding Corrigendum to letter dated November 8, 2019 intimating Change in Company Secretary and Compliance Officer, in the said letter date of resignation of Mr. Harish Agrawal, Company Secretary and Compliance Officer was erroneously mentioned as August 12, 2019 instead of August 31, 2019.
Capri Global Capital Limited - Outcome of Board Meeting
08-Nov-2019 | Source : NSECapri Global Capital Limited has informed the Exchange regarding Outcome of Board meeting held on November 08, 2019.
Capri Global Capital Limited - Updates
04-Nov-2019 | Source : NSECapri Global Capital Limited has informed the Exchange regarding 'Publication of the Notice of Board Meeting in Newspapers'.English newspaper Business Standard and Marathi newspaper i.e. Mumbai Lakshdeep
Corporate Actions

No Upcoming Board Meetings

Capri Global Capital Ltd has declared 20% dividend, ex-date: 11 Sep 25

Capri Global Capital Ltd has announced 1:2 stock split, ex-date: 05 Mar 24

Capri Global Capital Ltd has announced 1:1 bonus issue, ex-date: 05 Mar 24

Capri Global Capital Ltd has announced 11:64 rights issue, ex-date: 17 Feb 23
Quality key factors
Valuation key factors
Technicals key factors
 Technical Indicator Scale: Bearish, Mildly Bearish, Sideways, Mildly Bullish, Bullish Turned
 Shareholding Snapshot : Jun 2026
Shareholding Compare (%holding)
Promoters
None
Held by 18 Schemes (7.06%)
Held by 87 FIIs (8.21%)
Capri Global Ventures Private Limited (formally Known As Capri Global Holdings Private Limited) (41.1%)
Life Insurance Corporation Of India (7.98%)
2.64%
Quarterly Results Snapshot (Consolidated) - Jun'26 - YoY

YoY Growth in quarter ended Jun 2026 is 57.05% vs 39.87% in Jun 2025

YoY Growth in quarter ended Jun 2026 is 102.05% vs 130.98% in Jun 2025
Half Yearly Results Snapshot (Consolidated) - Sep'25
Growth in half year ended Sep 2025 is 44.63% vs 38.84% in Sep 2024
Growth in half year ended Sep 2025 is 137.91% vs 34.05% in Sep 2024
Nine Monthly Results Snapshot (Consolidated) - Dec'25
YoY Growth in nine months ended Dec 2025 is 46.21% vs 37.66% in Dec 2024
YoY Growth in nine months ended Dec 2025 is 121.53% vs 52.82% in Dec 2024
Annual Results Snapshot (Consolidated) - Mar'26
YoY Growth in year ended Mar 2026 is 45.67% vs 40.42% in Mar 2025
YoY Growth in year ended Mar 2026 is 98.35% vs 71.26% in Mar 2025
About Capri Global Capital Ltd

Company Coordinates


