
Compare Kaynes Tech with Similar Stocks
Dashboard
Flat results in Mar 26
- INTEREST(Latest six months) At Rs 65.73 cr has Grown at 28.38%
- DEBTORS TURNOVER RATIO(HY) Lowest at 2.37 times
- PAT(Q) At Rs 91.25 cr has Fallen at -6.5% (vs previous 4Q average)
With ROE of 7.7, it has a Very Expensive valuation with a 4.5 Price to Book Value
Underperformed the market in the last 1 year
Stock DNA
Industrial Manufacturing
INR 22,075 Cr (Mid Cap)
59.00
55
0.00%
0.02
7.70%
4.52
Total Returns (Price + Dividend) 
Kaynes Tech for the last several years.
Risk Adjusted Returns v/s
Returns Beta

News
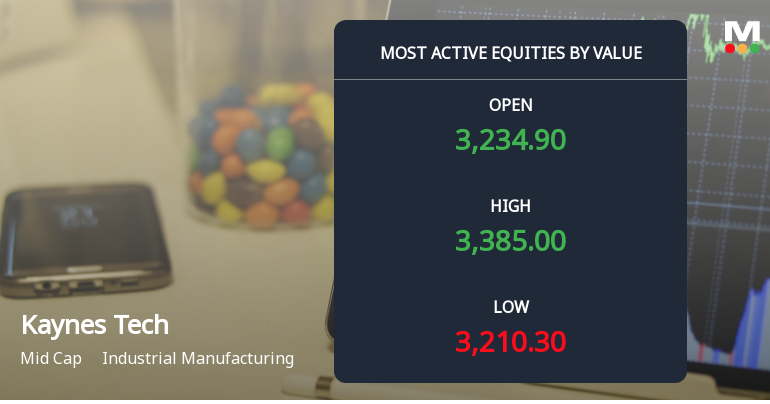
Kaynes Technology India Ltd Sees High-Value Trading Amid Institutional Interest
Kaynes Technology India Ltd, a mid-cap player in the Industrial Manufacturing sector, has emerged as one of the most actively traded stocks by value on 25 June 2026. The stock demonstrated a strong intraday performance, outpacing its sector and broader market indices, driven by heightened investor participation and significant institutional interest.
Read full news article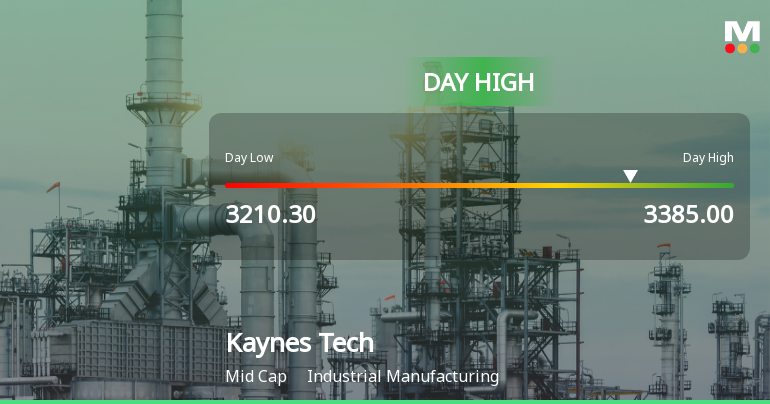
Kaynes Technology India Ltd Rallies 5.19% and Approaches 50 DMA Resistance — A Key Technical Test Ahead
The Sensex advanced 0.71% on 25 Jun 2026, yet Kaynes Technology India Ltd outperformed sharply with a 5.19% gain, touching an intraday high of Rs 3,347.15. This 4.33 percentage-point outperformance over its Industrial Manufacturing sector peers signals a stock-specific momentum shift rather than a mere market tailwind.
Read full news article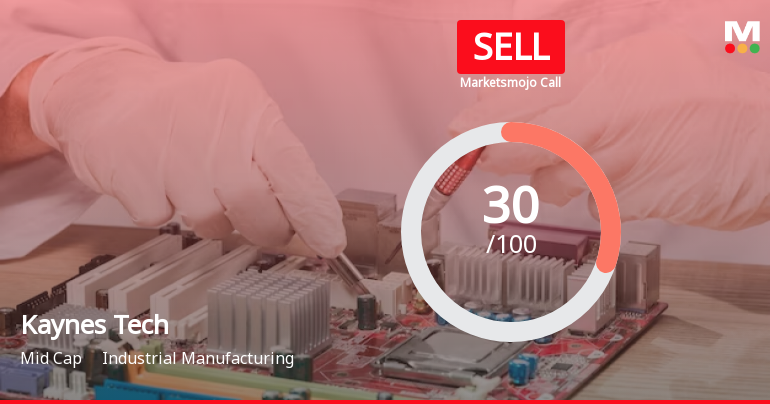
Kaynes Technology India Ltd is Rated Sell
Kaynes Technology India Ltd is rated Sell by MarketsMOJO, with this rating last updated on 28 April 2026. However, the analysis and financial metrics discussed here reflect the stock's current position as of 23 June 2026, providing investors with the latest insights into its performance and outlook.
Read full news article Announcements
Announcement under Regulation 30 (LODR)-Resignation of Director
29-May-2026 | Source : BSEResignation of Mr. Heinz Franz Moitzi as Independent Director w.e.f May 31 2026
Compliances-Reg.24(A)-Annual Secretarial Compliance
26-May-2026 | Source : BSEAnnual Secretarial Compliance Report
Announcement under Regulation 30 (LODR)-Earnings Call Transcript
19-May-2026 | Source : BSEQ4 & FY 2025-26 Earnings call Transcript
Corporate Actions

No Upcoming Board Meetings

No Dividend history available

No Splits history available

No Bonus history available

No Rights history available
Quality key factors
Valuation key factors
Technicals key factors
 Technical Indicator Scale: Bearish, Mildly Bearish, Sideways, Mildly Bullish, Bullish Turned
 Shareholding Snapshot : Mar 2026
Shareholding Compare (%holding)
Promoters
None
Held by 26 Schemes (12.98%)
Held by 155 FIIs (7.28%)
Ramesh Kunhikannan (53.43%)
Nippon Life India Trustee Ltd-a/c Nippon India Small Cap Fund (3.63%)
18.69%
Quarterly Results Snapshot (Consolidated) - Mar'26 - QoQ

QoQ Growth in quarter ended Mar 2026 is 54.55% vs -11.28% in Dec 2025
QoQ Growth in quarter ended Mar 2026 is 19.02% vs -36.88% in Dec 2025
Half Yearly Results Snapshot (Consolidated) - Sep'25

Growth in half year ended Sep 2025 is 46.80% vs 63.53% in Sep 2024
Growth in half year ended Sep 2025 is 76.62% vs 94.86% in Sep 2024
Nine Monthly Results Snapshot (Consolidated) - Dec'25
YoY Growth in nine months ended Dec 2025 is 37.21% vs 48.83% in Dec 2024
YoY Growth in nine months ended Dec 2025 is 53.66% vs 73.72% in Dec 2024
Annual Results Snapshot (Consolidated) - Mar'26
YoY Growth in year ended Mar 2026 is 33.24% vs 50.82% in Mar 2025
YoY Growth in year ended Mar 2026 is 24.01% vs 60.09% in Mar 2025
About Kaynes Technology India Ltd

Company Coordinates


