
Compare Macfos with Similar Stocks
Dashboard
Strong ability to service debt as the company has a low Debt to EBITDA ratio of 1.67 times
Healthy long term growth as Net Sales has grown by an annual rate of 57.08% and Operating profit at 52.49%
With a growth in Net Profit of 75.62%, the company declared Very Positive results in Mar 26
With ROCE of 26.5, it has a Expensive valuation with a 9 Enterprise value to Capital Employed
Despite the size of the company, domestic mutual funds hold only 0% of the company
Stock DNA
E-Retail/ E-Commerce
INR 1,224 Cr (Micro Cap)
44.00
70
0.00%
0.36
26.74%
11.89
Total Returns (Price + Dividend) 
Macfos for the last several years.
Risk Adjusted Returns v/s
Returns Beta

News

Macfos Ltd is Rated Hold by MarketsMOJO
Macfos Ltd is rated 'Hold' by MarketsMOJO, a rating that was last updated on 30 June 2026. While this rating change occurred at the end of June, the analysis and financial metrics discussed here reflect the company’s current position as of 03 August 2026, providing investors with the most up-to-date insight into the stock’s performance and outlook.
Read full news article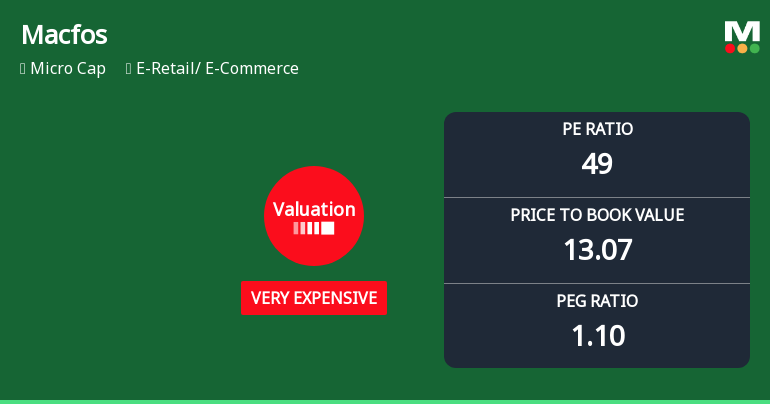
Macfos Ltd Valuation Shifts to Very Expensive Amid Strong Market Returns
Macfos Ltd, a micro-cap player in the E-Retail/E-Commerce sector, has seen its valuation metrics surge to levels categorised as very expensive, reflecting a significant shift in price attractiveness. Despite robust stock returns well above benchmark indices, the company’s price-to-earnings (P/E) and price-to-book value (P/BV) ratios now stand markedly higher than both historical averages and peer comparisons, prompting a downgrade in its Mojo Grade from Buy to Hold as of 30 June 2026.
Read full news article
Macfos Ltd is Rated Hold by MarketsMOJO
Macfos Ltd is rated 'Hold' by MarketsMOJO, with this rating last updated on 30 June 2026. However, the analysis and financial metrics presented here reflect the company’s current position as of 23 July 2026, providing investors with the latest insights into its performance and outlook.
Read full news article Announcements
Compliances-Certificate under Reg. 74 (5) of SEBI (DP) Regulations 2018
10-Jul-2026 | Source : BSEWith reference to the subject matter please find enclosed a certificate under Regulation 74 (5) of the SEBI (Depositories and Participants) Regulations 2018 for the quarter ended 30th June 2026 received from M/s Bigshare Services Pvt. Ltd. Registrar and Share Transfer Agent of our Company.
Reply To Non-Submission Of XBRL Filing For Board Meeting Outcome Pertaining To Bonus Issue Under Regulation 30 Of SEBI (LODR) Regulations 2015 - Macfos Ltd (Scrip Code: 543787)
10-Jul-2026 | Source : BSEWe have given the reply to the attached file.
Closure of Trading Window
26-Jun-2026 | Source : BSEPursuant to the Code of Conduct to Regulate Monitor and Report Trading in Securities of the Company the trading window for dealing in shares of the Company shall remain closed from July 01 2026 till 48 hours after the declaration of the Unaudited Financial Results for the Quarter ended 30th June 2026. for all the Designated Persons of the Company (including their Immediate Relatives). Accordingly all insiders of the company have been advised not to trade in the securities of the company during the aforesaid period of closure of the Trading Window. Further the Board Meeting date to consider and approve unaudited Financial Results for the Quarter ended 30th June 2026 shall be intimated to the Stock Exchanges in due course of time.
Corporate Actions

No Upcoming Board Meetings

No Dividend history available

No Splits history available

Macfos Ltd has announced 1:10 bonus issue, ex-date: 10 Mar 26

No Rights history available
Quality key factors
Valuation key factors
Technicals key factors
 Technical Indicator Scale: Bearish, Mildly Bearish, Sideways, Mildly Bullish, Bullish Turned
 Shareholding Snapshot : Jun 2026
Shareholding Compare (%holding)
Promoters
None
Held by 0 Schemes
Held by 1 FIIs (0.2%)
Binod Prasad (23.03%)
Sageone - Flagship Growth 2 Fund . (2.97%)
20.37%
Quarterly Results Snapshot (Consolidated) - Mar'26 - QoQ

QoQ Growth in quarter ended Mar 2026 is 29.47% vs 15.20% in Dec 2025
QoQ Growth in quarter ended Mar 2026 is 75.62% vs 9.98% in Dec 2025
Half Yearly Results Snapshot (Consolidated) - Mar'26
Growth in half year ended Mar 2026 is 41.73% vs 17.86% in Sep 2025
Growth in half year ended Mar 2026 is 52.61% vs 33.03% in Sep 2025
Nine Monthly Results Snapshot (Consolidated) - Dec'25

YoY Growth in nine months ended Dec 2025 is 7.34% vs 128.53% in Dec 2024
YoY Growth in nine months ended Dec 2025 is 20.94% vs 106.33% in Dec 2024
Annual Results Snapshot (Consolidated) - Mar'26
YoY Growth in year ended Mar 2026 is 21.06% vs 103.84% in Mar 2025
YoY Growth in year ended Mar 2026 is 43.08% vs 65.47% in Mar 2025
About Macfos Ltd

Company Coordinates


