
Compare Macfos with Similar Stocks
Dashboard
Strong ability to service debt as the company has a low Debt to EBITDA ratio of 1.67 times
Healthy long term growth as Net Sales has grown by an annual rate of 57.08% and Operating profit at 52.49%
With a growth in Net Profit of 75.62%, the company declared Very Positive results in Mar 26
With ROCE of 26.5, it has a Expensive valuation with a 8.7 Enterprise value to Capital Employed
Despite the size of the company, domestic mutual funds hold only 0% of the company
Stock DNA
E-Retail/ E-Commerce
INR 1,129 Cr (Micro Cap)
43.00
77
0.00%
0.36
26.74%
11.45
Total Returns (Price + Dividend) 
Macfos for the last several years.
Risk Adjusted Returns v/s
Returns Beta

News
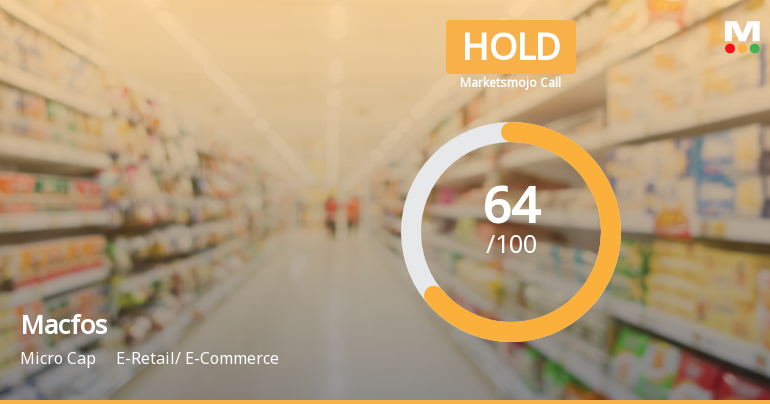
Macfos Ltd is Rated Hold by MarketsMOJO
Macfos Ltd is rated 'Hold' by MarketsMOJO, with this rating last updated on 14 May 2026. However, the analysis and financial metrics discussed here reflect the stock's current position as of 17 June 2026, providing investors with an up-to-date perspective on the company’s performance and outlook.
Read full news article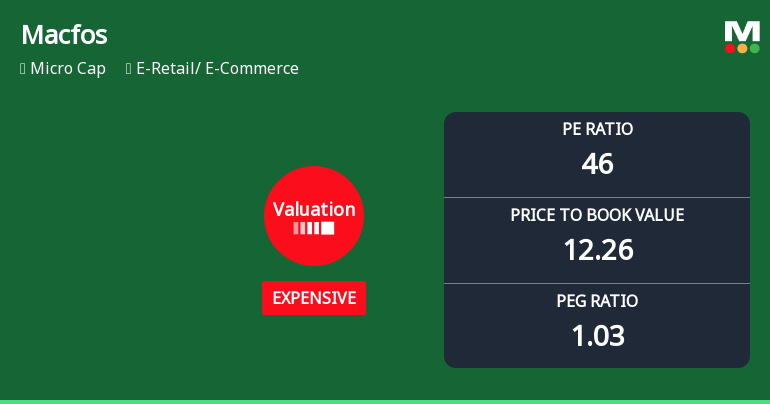
Macfos Ltd Valuation Shifts Amidst Market Volatility: A Detailed Analysis
Macfos Ltd, a micro-cap player in the e-retail and e-commerce sector, has experienced a notable shift in its valuation parameters, prompting a downgrade in its mojo grade from Buy to Hold. Despite robust returns relative to the Sensex over multiple timeframes, the company’s price-to-earnings (P/E) and price-to-book value (P/BV) ratios have moved from very expensive to merely expensive, signalling a recalibration of price attractiveness in a competitive market environment.
Read full news article
Macfos Ltd is Rated Hold by MarketsMOJO
Macfos Ltd is rated 'Hold' by MarketsMOJO, with this rating last updated on 14 May 2026. However, the analysis and financial metrics discussed here reflect the stock's current position as of 08 June 2026, providing investors with an up-to-date view of the company’s performance and outlook.
Read full news article Announcements
Re-Submission Of Audited Financial Results For The Quarter Half Year And Year Ended 31St March 2026 As Per Regulation 33 Of SEBI (LODR) Regulations 2015 - Correction Of Clerical Error In Consolidated Cash Flow Statement
12-May-2026 | Source : BSEWhile reviewing the submitted results it has been brought to our notice that a clerical error had inadvertently occurred in the Consolidated Cash Flow Statement. Specifically the line items of Inventories and Trade Receivables were inadvertently interchanged in their respective positions in the said statement. We hereby confirm that the said error is purely clerical in nature. The aforesaid error has now been duly rectified and we are re-submitting the Revised Consolidated Financial Results with the correct positioning of the above-mentioned line items in the Consolidated Cash Flow Statement.
Announcement under Regulation 30 (LODR)-Earnings Call Transcript
02-May-2026 | Source : BSEPursuant to Regulations 30 and 46 of the SEBI (Listing Obligations and Disclosure Requirements) Regulations 2015. Please find enclosed herewith the transcript of the Earnings Conference Call held on 30th April 2026 in relation to the financial results for the half year and year ended 31st March 2026 (H2 & FY 2025-26).
Announcement under Regulation 30 (LODR)-Analyst / Investor Meet - Outcome
30-Apr-2026 | Source : BSEPursuant to Regulations 30 and 46(2) (oa) of the SEBI (Listing Obligations and Disclosure Requirements) Regulations 2015 as amended we hereby inform you that the audio call recording of the Companys H2 & FY 2025-26 Investors & Analysts Conference Call on 30th April 2026 is available on the Companys website. The link to access the said audio recording is: https://robu-prod-media.s3.ap-south-1.amazonaws.com/media/2026/04/Hqa3hPaTLOfAzokQhK8p4T8jiTG794tYb3ydZF4G.mp3
Corporate Actions

No Upcoming Board Meetings

No Dividend history available

No Splits history available

Macfos Ltd has announced 1:10 bonus issue, ex-date: 10 Mar 26

No Rights history available
Quality key factors
Valuation key factors
Technicals key factors
 Technical Indicator Scale: Bearish, Mildly Bearish, Sideways, Mildly Bullish, Bullish Turned
 Shareholding Snapshot : Mar 2026
Shareholding Compare (%holding)
Promoters
None
Held by 0 Schemes
Held by 1 FIIs (0.2%)
Binod Prasad (23.03%)
Sageone - Flagship Growth 2 Fund . (2.97%)
19.74%
Quarterly Results Snapshot (Consolidated) - Mar'26 - QoQ

QoQ Growth in quarter ended Mar 2026 is 29.47% vs 15.20% in Dec 2025
QoQ Growth in quarter ended Mar 2026 is 75.62% vs 9.98% in Dec 2025
Half Yearly Results Snapshot (Consolidated) - Mar'26
Growth in half year ended Mar 2026 is 41.73% vs 17.86% in Sep 2025
Growth in half year ended Mar 2026 is 52.61% vs 33.03% in Sep 2025
Nine Monthly Results Snapshot (Consolidated) - Dec'25

YoY Growth in nine months ended Dec 2025 is 7.34% vs 128.53% in Dec 2024
YoY Growth in nine months ended Dec 2025 is 20.94% vs 106.33% in Dec 2024
Annual Results Snapshot (Consolidated) - Mar'26
YoY Growth in year ended Mar 2026 is 21.06% vs 103.84% in Mar 2025
YoY Growth in year ended Mar 2026 is 43.08% vs 65.47% in Mar 2025
About Macfos Ltd

Company Coordinates


