
Compare Muthoot Microfin with Similar Stocks
Dashboard
With a growth in Net Profit of 13.9%, the company declared Outstanding results in Mar 26
- The company has declared positive results for the last 4 consecutive quarters
- OPERATING PROFIT TO INTEREST(Q) Highest at 1.43 times
- PAT(Q) At Rs 71.12 cr has Grown at 194.2% (vs previous 4Q average)
- NET SALES(Q) Highest at Rs 631.81 cr
High Institutional Holdings at 26.49%
Market Beating Performance
Total Returns (Price + Dividend) 
Muthoot Microfin for the last several years.
Risk Adjusted Returns v/s
Returns Beta

News

Muthoot Microfin Ltd is Rated Buy by MarketsMOJO
Muthoot Microfin Ltd is rated Buy by MarketsMOJO, with this rating last updated on 16 June 2026. However, the analysis and financial metrics discussed here reflect the company’s current position as of 31 July 2026, providing investors with the latest insights into its performance and outlook.
Read full news article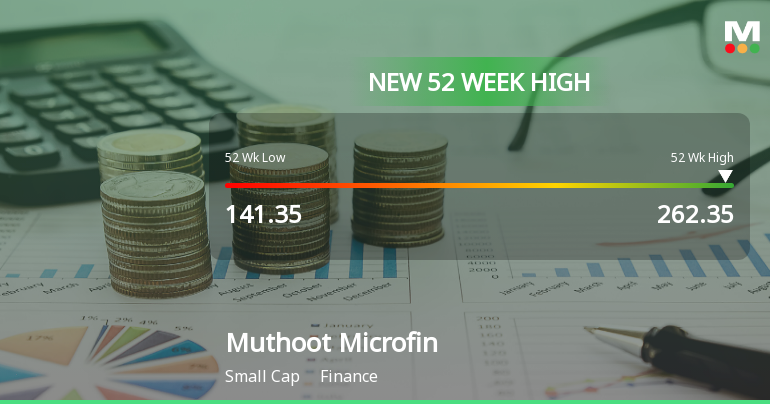
Broad-Based Technical Strength Lifts Muthoot Microfin Ltd to 52-Week High of Rs 262.35
With a 52.81% gain over the past year, Muthoot Microfin Ltd has surged to a fresh 52-week high of Rs 262.35 on 27 Jul 2026, significantly outperforming the Sensex which declined by 5.94% over the same period. This milestone caps a sustained rally fuelled by strong technical momentum and improving fundamentals.
Read full news article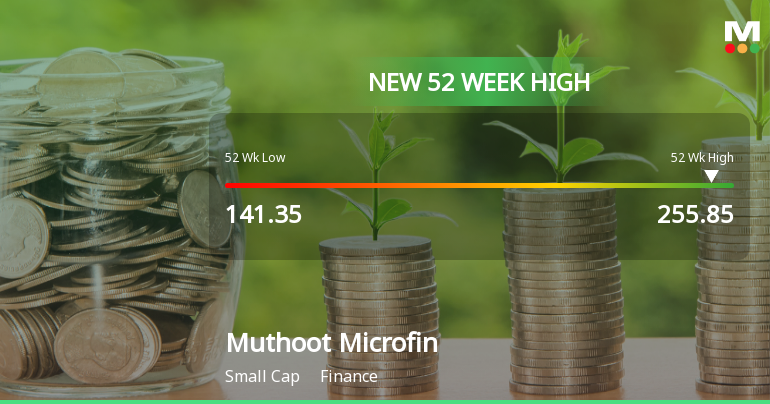
Broad-Based Technical Strength Lifts Muthoot Microfin Ltd to 52-Week High of Rs 255.85
Surging past its previous peak, Muthoot Microfin Ltd reached a fresh 52-week high of Rs 255.85 on 21 Jul 2026, marking a remarkable 51.22% gain over the past year. This milestone comes amid a backdrop of strong technical momentum and sustained earnings growth, setting the stage for a compelling price rally.
Read full news article Announcements
Update On Public Notice Dated July 21 2026
28-Jul-2026 | Source : BSEUpdate on public notice dated July 21 2026
Board Meeting Intimation for To Consider And Approve The Unaudited Financial Results Of The Company For The Quarter Ended June 30 2026 Along With The Limited Review Report Of The Statutory Auditors.
27-Jul-2026 | Source : BSEMuthoot Microfin Ltdhas informed BSE that the meeting of the Board of Directors of the Company is scheduled on 06/08/2026 inter alia to consider and approve the unaudited financial results of the Company for the quarter ended June 30 2026 along with the limited review report of the Statutory Auditors.
Announcement under Regulation 30 (LODR)-Newspaper Publication
21-Jul-2026 | Source : BSENewspaper Publication
Corporate Actions

06 Aug 2026

No Dividend history available

No Splits history available

No Bonus history available

No Rights history available
Quality key factors
Valuation key factors
Technicals key factors
 Technical Indicator Scale: Bearish, Mildly Bearish, Sideways, Mildly Bullish, Bullish Turned
 Shareholding Snapshot : Jun 2026
Shareholding Compare (%holding)
Promoters
None
Held by 1 Schemes (0.0%)
Held by 17 FIIs (0.35%)
Muthoot Fincorp Ltd (50.21%)
Greater Pacific Capital Wiv Ltd (15.13%)
13.65%
Quarterly Results Snapshot (Standalone) - Mar'26 - QoQ

QoQ Growth in quarter ended Mar 2026 is 4.81% vs 4.59% in Dec 2025

QoQ Growth in quarter ended Mar 2026 is 13.90% vs 104.59% in Dec 2025
Half Yearly Results Snapshot (Standalone) - Sep'25
Growth in half year ended Sep 2025 is -14.40% vs 27.20% in Sep 2024
Growth in half year ended Sep 2025 is -79.01% vs -14.83% in Sep 2024
Nine Monthly Results Snapshot (Standalone) - Dec'25
YoY Growth in nine months ended Dec 2025 is -13.40% vs 23.94% in Dec 2024
YoY Growth in nine months ended Dec 2025 is -44.50% vs -45.84% in Dec 2024
Annual Results Snapshot (Standalone) - Mar'26
YoY Growth in year ended Mar 2026 is -7.50% vs 13.91% in Mar 2025
YoY Growth in year ended Mar 2026 is 176.52% vs -149.50% in Mar 2025
About Muthoot Microfin Ltd

Company Coordinates


