
Compare Epack Durable with Similar Stocks
Dashboard
Weak Long Term Fundamental Strength with a -14.68% CAGR growth in Operating Profits over the last 5 years
- Low ability to service debt as the company has a high Debt to EBITDA ratio of 6.56 times
- The company has been able to generate a Return on Equity (avg) of 3.07% signifying low profitability per unit of shareholders funds
The company has declared Negative results for the last 3 consecutive quarters
Below par performance in long term as well as near term
Stock DNA
Electronics & Appliances
INR 2,257 Cr (Small Cap)
750.00
88
0.00%
0.75
0.34%
2.54
Total Returns (Price + Dividend) 
Epack Durable for the last several years.
Risk Adjusted Returns v/s
Returns Beta

News
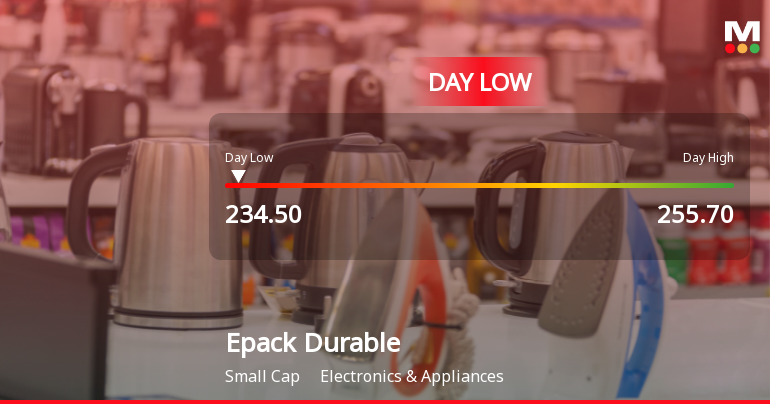
Epack Durable Ltd Hits Intraday Low Amid Price Pressure on 23 Jun 2026
Epack Durable Ltd experienced a notable decline today, touching an intraday low of Rs 237.8 as the stock faced significant price pressure amid broader market weakness and sector underperformance.
Read full news article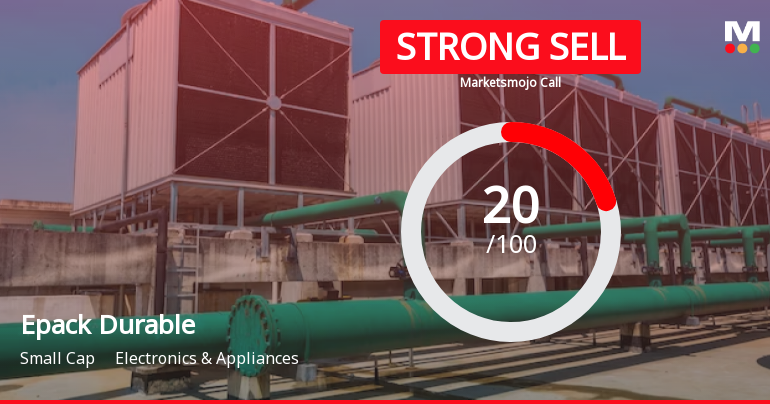
Epack Durable Ltd is Rated Strong Sell
Epack Durable Ltd is rated Strong Sell by MarketsMOJO, with this rating last updated on 04 May 2026. However, the analysis and financial metrics presented here reflect the stock's current position as of 23 June 2026, providing investors with the latest insights into the company’s performance and outlook.
Read full news article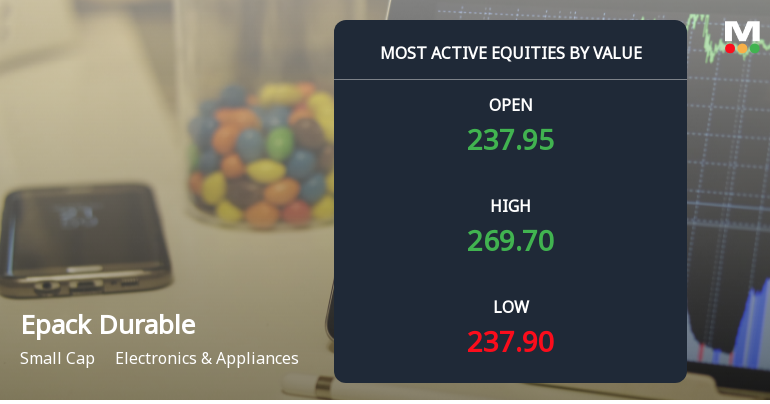
Epack Durable Ltd Surges on Heavy Value Trading Amid Institutional Caution
Epack Durable Ltd (EPACK), a small-cap player in the Electronics & Appliances sector, witnessed a remarkable surge in trading activity on 22 June 2026, with its stock price rallying 14.83% intraday amid one of the highest value turnovers on the market. Despite this strong performance, the company remains under a Strong Sell rating from MarketsMOJO, reflecting ongoing concerns about its fundamentals and outlook.
Read full news article Announcements
Announcement under Regulation 30 (LODR)-Change in Management
15-Jun-2026 | Source : BSEEPACK Durable Limited has informed the Exchange about the resignation of Senior Management Personnel.
Announcement Under Regulation 30 Of SEBI Listing Regulations 2015 - General Updates
12-Jun-2026 | Source : BSEEPACK Durable Limited has informed the Exchange about the General Updates.
Announcement under Regulation 30 (LODR)-Earnings Call Transcript
27-May-2026 | Source : BSEEPACK Durable Limited has submitted Transcript of Earning Call held on May 21 2026.
Corporate Actions

No Upcoming Board Meetings

No Dividend history available

No Splits history available

No Bonus history available

No Rights history available
Quality key factors
Valuation key factors
Technicals key factors
 Technical Indicator Scale: Bearish, Mildly Bearish, Sideways, Mildly Bullish, Bullish Turned
 Shareholding Snapshot : Mar 2026
Shareholding Compare (%holding)
Promoters
3.8544
Held by 4 Schemes (4.81%)
Held by 18 FIIs (0.29%)
Sanjay Singhania (8.83%)
Augusta Investments Zero Pte. Ltd. (6.1%)
32.52%
Quarterly Results Snapshot (Consolidated) - Mar'26 - QoQ

QoQ Growth in quarter ended Mar 2026 is 38.18% vs 100.58% in Dec 2025
QoQ Growth in quarter ended Mar 2026 is -99.23% vs 111.64% in Dec 2025
Half Yearly Results Snapshot (Consolidated) - Sep'25
Growth in half year ended Sep 2025 is -23.91% vs 87.18% in Sep 2024
Growth in half year ended Sep 2025 is -95.64% vs 463.02% in Sep 2024
Nine Monthly Results Snapshot (Consolidated) - Dec'25
YoY Growth in nine months ended Dec 2025 is -14.68% vs 70.90% in Dec 2024
YoY Growth in nine months ended Dec 2025 is -81.41% vs 131.17% in Dec 2024
Annual Results Snapshot (Consolidated) - Mar'26
YoY Growth in year ended Mar 2026 is -12.73% vs 52.93% in Mar 2025
YoY Growth in year ended Mar 2026 is -94.09% vs 55.89% in Mar 2025
About Epack Durable Ltd

Company Coordinates


