
Compare Bosch Home Comfo with Similar Stocks
Dashboard
Weak Long Term Fundamental Strength with a -25.06% CAGR growth in Operating Profits over the last 5 years
- Company's ability to service its debt is weak with a poor EBIT to Interest (avg) ratio of -0.38
- The company has been able to generate a Return on Equity (avg) of 2.90% signifying low profitability per unit of shareholders funds
Negative results in Mar 26
With ROE of 3.1, it has a Expensive valuation with a 7.2 Price to Book Value
29.19% of Promoter Shares are Pledged
Below par performance in long term as well as near term
Stock DNA
Electronics & Appliances
INR 3,616 Cr (Small Cap)
236.00
89
0.00%
0.05
3.06%
7.15
Total Returns (Price + Dividend) 
Latest dividend: 36 per share ex-dividend date: Jul-09-2025
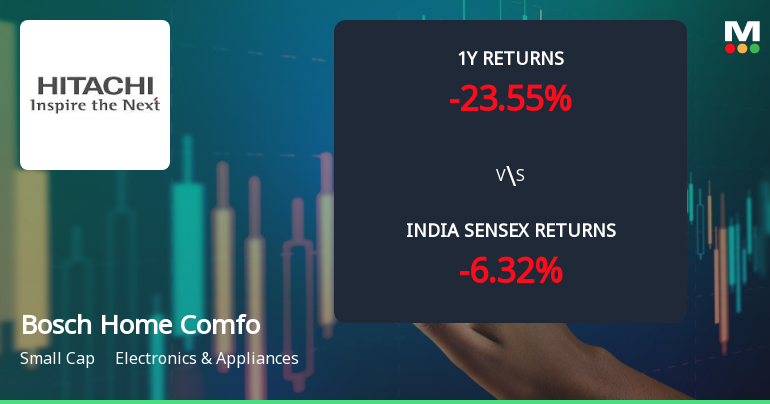
Risk Adjusted Returns v/s
Returns Beta

News
Bosch Home Comfort India Ltd Faces Bearish Momentum Amid Technical Downturn
Bosch Home Comfort India Ltd has experienced a notable shift in its technical momentum, with key indicators signalling a transition from mildly bearish to a more pronounced bearish trend. Despite a strong Mojo Score of 9.0, the company’s technical grade was downgraded to Strong Sell on 25 July 2025, reflecting growing concerns among investors as the stock price continues to underperform relative to benchmarks.
Read full news article
Bosch Home Comfort India Ltd Technical Momentum Shifts Amid Mixed Market Signals
Bosch Home Comfort India Ltd has experienced a nuanced shift in its technical parameters, reflecting a complex interplay of bullish and bearish signals across multiple timeframes. While the stock shows signs of mild bullish momentum on weekly indicators, monthly trends remain predominantly bearish, underscoring the challenges faced by this small-cap player in the Electronics & Appliances sector.
Read full news article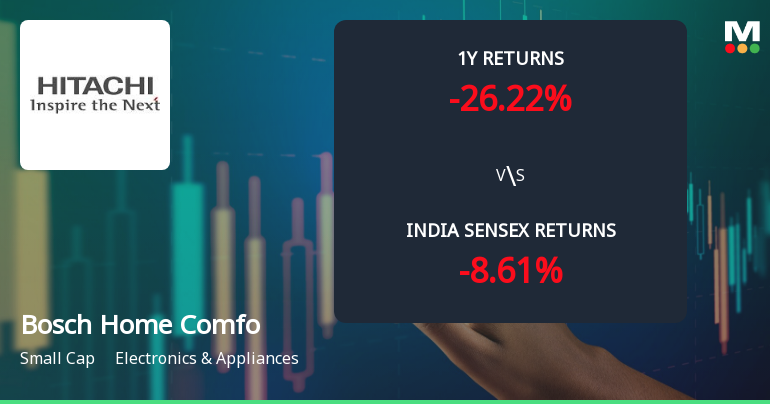
Bosch Home Comfort India Ltd Faces Bearish Momentum Amid Technical Downgrade
Bosch Home Comfort India Ltd has experienced a notable shift in its technical momentum, with recent indicators signalling a transition from mildly bearish to a more pronounced bearish trend. Despite a modest 0.40% gain in the latest session, the stock’s broader technical landscape reveals a complex interplay of bullish and bearish signals, raising questions about its near-term trajectory within the Electronics & Appliances sector.
Read full news article Announcements
Johnson Controls - Hitachi Air Conditioning India Limited - Other General Purpose
13-Nov-2019 | Source : NSEJohnson Controls - Hitachi Air Conditioning India Limited has informed the Exchange that Related party transactions for the Half year ended 30th September, 2019 are attached.
Shareholders meeting
14-Aug-2019 | Source : NSE
| Johnson Controls - Hitachi Air Conditioning India Limited has informed the Exchange regarding Proceedings of Annual General Meeting held on August 14, 2019 |
Financial Result Updates
14-Aug-2019 | Source : NSE
| Johnson Controls - Hitachi Air Conditioning India Limited has submitted to the Exchange, the financial results for the period ended June 30, 2019. |
Corporate Actions

06 Aug 2026

Bosch Home Comfort India Ltd has declared 360% dividend, ex-date: 09 Jul 25

No Splits history available

No Bonus history available

Bosch Home Comfort India Ltd has announced 1:5 rights issue, ex-date: 05 Mar 13
Quality key factors
Valuation key factors
Technicals key factors
 Technical Indicator Scale: Bearish, Mildly Bearish, Sideways, Mildly Bullish, Bullish Turned
 Shareholding Snapshot : Mar 2026
Shareholding Compare (%holding)
Promoters
29.1889
Held by 3 Schemes (0.96%)
Held by 24 FIIs (0.67%)
Jchac India Holdco Limited (74.25%)
None
12.51%
Quarterly Results Snapshot (Standalone) - Mar'26 - YoY

YoY Growth in quarter ended Mar 2026 is 3.52% vs 20.83% in Mar 2025
YoY Growth in quarter ended Mar 2026 is -27.11% vs 14.87% in Mar 2025
Half Yearly Results Snapshot (Standalone) - Sep'25
Growth in half year ended Sep 2025 is -9.66% vs 64.31% in Sep 2024
Growth in half year ended Sep 2025 is -505.08% vs 106.26% in Sep 2024
Nine Monthly Results Snapshot (Standalone) - Dec'25
YoY Growth in nine months ended Dec 2025 is -4.96% vs 59.03% in Dec 2024
YoY Growth in nine months ended Dec 2025 is -1,684.78% vs 102.22% in Dec 2024
Annual Results Snapshot (Standalone) - Mar'26
YoY Growth in year ended Mar 2026 is -2.10% vs 43.66% in Mar 2025
YoY Growth in year ended Mar 2026 is -104.50% vs 177.70% in Mar 2025
About Bosch Home Comfort India Ltd

Company Coordinates


