
Compare IFB Industries with Similar Stocks
Stock DNA
Electronics & Appliances
INR 5,605 Cr (Small Cap)
36.00
53
0.00%
-0.23
15.49%
5.62
Total Returns (Price + Dividend) 
IFB Industries for the last several years.
Risk Adjusted Returns v/s
Returns Beta

News

IFB Industries Ltd Technical Momentum Shifts Amid Mixed Market Signals
IFB Industries Ltd, a small-cap player in the Electronics & Appliances sector, has experienced a notable shift in its technical momentum, reflecting a complex interplay of bullish and bearish signals across multiple timeframes. Despite a recent downgrade in daily moving averages and a 2.81% dip in the latest session, the stock’s weekly and monthly technical indicators present a nuanced picture that investors should carefully analyse.
Read full news article
IFB Industries Ltd Upgraded to Buy on Strong Financials and Technical Recovery
IFB Industries Ltd has been upgraded from a Hold to a Buy rating following a comprehensive reassessment of its quality, valuation, financial trend, and technical indicators. The company’s recent quarterly performance, combined with a shift in technical momentum and attractive valuation metrics, has prompted this positive revision, signalling renewed investor confidence in the electronics and appliances sector player.
Read full news article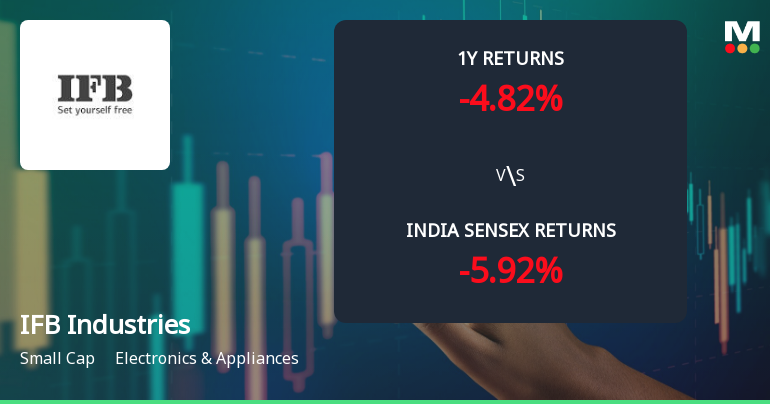
IFB Industries Ltd Sees Technical Momentum Shift Amid Mixed Market Signals
IFB Industries Ltd has experienced a notable shift in its technical momentum, moving from a mildly bearish to a mildly bullish trend, supported by a blend of bullish and bearish signals across key technical indicators. The stock’s recent price action, combined with its evolving technical profile, suggests cautious optimism among investors in the Electronics & Appliances sector.
Read full news article Announcements
IFB Industries Limited - Updates
05-Dec-2019 | Source : NSEIFB Industries Limited has informed the Exchange regarding 'This is to inform you that a fire broke out on 2nd December 2019 at around 11.20 PM at our ware house at Khasra No 31/2/1/2,9/1,1/3,8/10/1,2/2 Bilaspur-Tauru Road, Gudhi village, District Mewat, Haryana, India- 122105. The estimation of loss is yet to be ascertained. The above disclosure is in terms of Regulation 30 (4) of SEBI (LODR) Regulation 2015.'.
IFB Industries Limited - Analysts/Institutional Investor Meet/Con. Call Updates
05-Nov-2019 | Source : NSEIFB Industries Limited has informed the Exchange regarding Analysts/Institutional Investor Meet/Con. Call UpdatesSub: Investors Presentation and Conference call with Investors of IFB Industries Limited
IFB Industries Limited - Outcome of Board Meeting
04-Nov-2019 | Source : NSEIFB Industries Limited has informed the Exchange regarding Board meeting held on November 02, 2019.This is to inform you that the Board of Directors of the Company at its meeting held on 2nd November, 2019 inducted Mr. Chacko Joseph as an Independent Director of the Company.
Corporate Actions

28 Jul 2026

No Dividend history available

No Splits history available

No Bonus history available

No Rights history available
Quality key factors
Valuation key factors
Technicals key factors
 Technical Indicator Scale: Bearish, Mildly Bearish, Sideways, Mildly Bullish, Bullish Turned
 Shareholding Snapshot : Mar 2026
Shareholding Compare (%holding)
Promoters
None
Held by 16 Schemes (5.5%)
Held by 36 FIIs (0.92%)
Ifb Automotive Private Limited (46.54%)
Dsp Small Cap Fund (4.66%)
12.65%
Quarterly Results Snapshot (Consolidated) - Mar'26 - YoY

YoY Growth in quarter ended Mar 2026 is 12.33% vs 22.34% in Mar 2025

YoY Growth in quarter ended Mar 2026 is 126.13% vs 57.25% in Mar 2025
Half Yearly Results Snapshot (Consolidated) - Sep'25
Growth in half year ended Sep 2025 is 8.85% vs 13.80% in Sep 2024
Growth in half year ended Sep 2025 is 11.60% vs 229.75% in Sep 2024
Nine Monthly Results Snapshot (Consolidated) - Dec'25
YoY Growth in nine months ended Dec 2025 is 9.67% vs 12.26% in Dec 2024
YoY Growth in nine months ended Dec 2025 is 0.85% vs 160.79% in Dec 2024
Annual Results Snapshot (Consolidated) - Mar'26
YoY Growth in year ended Mar 2026 is 10.37% vs 14.73% in Mar 2025
YoY Growth in year ended Mar 2026 is 20.73% vs 136.12% in Mar 2025
About IFB Industries Ltd

Company Coordinates


