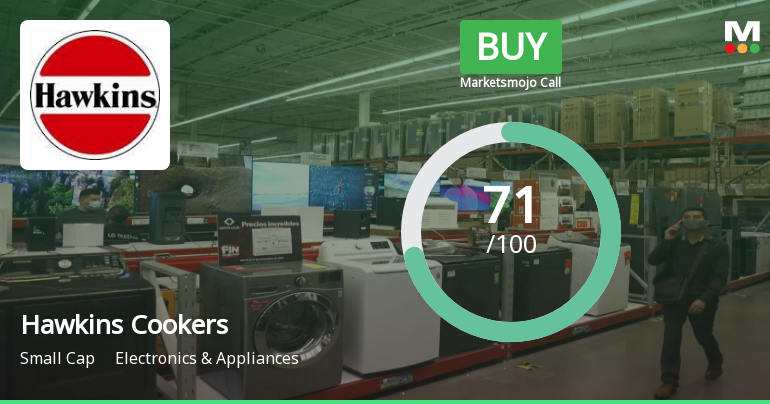
Hawkins Cookers

  • Market Cap: Small Cap
  • Industry: Electronics & Appliances
  • ISIN: INE979B01015
  • NSEID: HAWKINCOOK
  • BSEID: 508486
INR
8,161.00
9 (0.11%)
BSENSE

Sep 02, 12:20 PM

BSE+NSE Vol: 728

  • Price Points
  • Score
  • Mojo Parameters
  • Total Return
  • News and Corporate Actions
  • Key factors
  • Shareholding
  • Financials
  • CompanyCV
stock-summaryPrice Point
High/Low

1Day

52 Week

Valuation
Technical
Day's Volume

CASH

728 (269.54%) Volume

Shareholding (Jun 2026)

FII

2.74%

Held by 8 FIIs

DII

16.02%

Held by 13 DIIs

Promoter

56.03%

Why is Hawkins Cookers Ltd falling/rising?

02-Sep-2026

As of 01-Sep, Hawkins Cookers Ltd's stock price is declining, currently at 8,133.40, with a total drop of 1.41% over the last three days and 4.38% over the past month. Despite some positive financial indicators, the stock's long-term growth prospects appear weak, contributing to its downward trend.

As of 01-Sep, Hawkins Cookers Ltd's stock price is falling, currently at 8,133.40, reflecting a decrease of 55.6 points or 0.68%. The stock has been on a downward trend, having lost value for the last three consecutive days, resulting in a total decline of 1.41% during this period. Additionally, the stock's performance over the past month shows a decline of 4.38%, while it has underperformed the market over the last year with a significant drop of 8.47% compared to the BSE500's positive return of 2.32%.<BR><BR>Investor participation has also decreased, as indicated by a 32.74% drop in delivery volume on August 31 compared to the five-day average. Although the stock has outperformed its sector by 0.25% today, it remains below its 5-day, 20-day, and 50-day moving averages, which suggests a lack of short-term momentum. <BR><BR>Despite some positive financial indicators, such as a high return on equity and net sales growth, the overall long-term growth prospects appear weak, with net sales and operating profit growing at annual rates of only 10.21% and 7.81%, respectively, over the last five years. This combination of declining stock performance, reduced investor interest, and poor long-term growth expectations contributes to the current downward trend in Hawkins Cookers Ltd's stock price.

View full answer

Who are in the management team of Hawkins Cookers?

01-Sep-2026

The management team of Hawkins Cookers includes S Dutta Choudhury (Chairman, Managing Director & CEO), Sudeep Yadav (Vice Chairman & CFO), and several executive directors, along with independent and non-executive directors who provide strategic oversight and governance.

The management team of Hawkins Cookers includes the following key members:<BR><BR>1. **S Dutta Choudhury** - Chairman, Managing Director & CEO<BR>2. **Sudeep Yadav** - Vice Chairman & CFO<BR>3. **Tej Paul Sharma** - Executive Director<BR>4. **Neil Vasudeva** - Executive Director (Marketing)<BR>5. **Brahmananda Pani** - Company Secretary & Compliance Officer<BR><BR>Additionally, the board features several independent and non-executive directors, including:<BR><BR>- **V N Sharma** - Independent Director<BR>- **Eknath Kshirsagar** - Independent Director<BR>- **Susan Vasudeva** - Non-Executive Director<BR>- **Ravi Kant** - Independent Director<BR>- **Leena Chatterjee** - Independent Director<BR>- **Murli Aildas Teckchandani** - Independent Director<BR><BR>This team brings a diverse range of expertise to the company, contributing to its strategic direction and governance.

View full answer

What does Hawkins Cookers do?

01-Sep-2026

Hawkins Cookers Ltd is a manufacturer of pressure cookers and cookware, established in 1959, with a market cap of INR 4,310 Cr and reported net sales of 318 Cr and net profit of 30 Cr for June 2026. Key metrics include a P/E ratio of 32.00 and a dividend yield of 1.71%.

Overview: <BR>Hawkins Cookers Ltd is a manufacturer of pressure cookers and cookware, operating in the Electronics & Appliances industry within the small-cap market segment.<BR><BR>History: <BR>Hawkins Cookers Ltd was established on February 25, 1959, originally under the name Pressure Cookers and Appliances Limited. The company rebranded to its current name in 1986. The latest reported quarterly results indicate net sales and net profit for June 2026.<BR><BR>Financial Snapshot: <BR>Net Sales: 318 Cr (Quarterly Results - Jun 2026) <BR>Net Profit: 30 Cr (Quarterly Results - Jun 2026) <BR>Market Cap: INR 4,310 Cr (Small Cap)<BR><BR>Key Metrics: <BR>P/E: 32.00 <BR>Industry P/E: 55 <BR>Dividend Yield: 1.71% <BR>Debt Equity: -0.36 <BR>Return on Equity: 30.46% <BR>Price to Book: 9.73<BR><BR>Contact Details: <BR>Address: F 101 Maker Tower, 10th Floor Cuffe Parade Mumbai Maharashtra : 400005 <BR>Tel: 91-22-22186607 <BR>Email: ho@hawkinscookers.com <BR>Website: http://www.hawkinscookers.com

View full answer

Who are the peers of the Hawkins Cookers?

01-Sep-2026

Hawkins Cookers' peers include Eureka Forbes, TTK Prestige, Cello World, IFB Industries, Bosch Home Comfo, Symphony, Orient Electric, Bajaj Electrical, Carysil, and Stove Kraft. In terms of management risk, growth, and capital structure, Eureka Forbes stands out, while Hawkins Cookers shows below-average growth and a 1-year return of -8.68%.

Peers: Hawkins Cookers' peers include Eureka Forbes, TTK Prestige, Cello World, IFB Industries, Bosch Home Comfo, Symphony, Orient Electric, Bajaj Electrical, Carysil, and Stove Kraft.<BR><BR>Quality Snapshot: Excellent management risk is observed at Hawkins Cookers and Eureka Forbes, while Good management risk is found at TTK Prestige, Symphony, Orient Electric, and Carysil. Average management risk is present at Cello World, IFB Industries, Bosch Home Comfo, and Bajaj Electrical, and the rest. Below Average management risk is noted at Stove Kraft. In terms of Growth, Excellent growth is seen at Eureka Forbes, while Good growth is found at IFB Industries. Below Average growth is observed at Hawkins Cookers, TTK Prestige, Cello World, Symphony, Orient Electric, Bajaj Electrical, and the rest. Average growth is noted at Bosch Home Comfo and Carysil. Capital Structure ratings are Excellent for Eureka Forbes, Hawkins Cookers, TTK Prestige, Symphony, and Orient Electric, while Good is seen at IFB Industries, Bosch Home Comfo, and Stove Kraft. Average capital structure is noted at Carysil and Bajaj Electrical.<BR><BR>Return Snapshot: The peer with the highest 1-year return is Carysil at 31.78%, while the lowest is Symphony at -37.18%. Hawkins Cookers' own 1-year return is -8.68%, which is better than Symphony's but worse than Carysil's. Additionally, peers such as Symphony, Bajaj Electrical, and Cello World have negative six-month returns.

View full answer

How big is Hawkins Cookers?

01-Sep-2026

As of 31st August, Hawkins Cookers Ltd has a market capitalization of 4,310.00 Cr, with recent net sales of 1,331.98 Cr and a net profit of 135.63 Cr.

As of 31st August, Hawkins Cookers Ltd has a market capitalization of 4,310.00 Cr, categorizing it as a Small Cap company.<BR><BR>In the latest four quarters, Hawkins Cookers reported Net Sales of 1,331.98 Cr and a Net Profit of 135.63 Cr.<BR><BR>The latest annual period for the balance sheet is March 2026, with Shareholder's Funds amounting to 445.25 Cr and Total Assets of 688.22 Cr.

View full answer

Are Hawkins Cookers Ltd latest results good or bad?

30-Jul-2026

Hawkins Cookers Ltd's latest results show a net profit increase of 17.14% and a revenue growth of 33.06%, indicating strong demand. However, declining operating margins and rising costs raise concerns about long-term profitability, warranting careful monitoring.

Hawkins Cookers Ltd's latest results present a mixed picture. On the positive side, the company reported a net profit of ₹30.38 crores for Q1 FY27, which is a 17.14% increase quarter-on-quarter and a 17.12% increase year-on-year. Additionally, revenue grew by an impressive 33.06% year-on-year, reflecting strong consumer demand for kitchen appliances.<BR><BR>However, there are notable concerns regarding margin pressures. The operating margin has declined to 13.43%, down from 15.10% in the previous quarter, indicating rising costs that could affect profitability in the long term. This margin compression, combined with a sequential revenue decline of 12.94%, suggests that while the company is growing its top line, it faces challenges in maintaining profitability.<BR><BR>Overall, while the revenue growth and net profit increase are encouraging, the declining margins warrant careful monitoring as they could impact the company’s valuation and future performance. Investors should keep an eye on how Hawkins manages these cost pressures moving forward.

View full answer

Should I buy, sell or hold Hawkins Cookers Ltd?

30-Jul-2026

Is Hawkins Cookers overvalued or undervalued?

04-Dec-2025

As of December 3, 2025, Hawkins Cookers is considered an attractive investment with a PE ratio of 36.59, competitive valuation metrics compared to peers, and a strong ROE of 30.48%, despite a year-to-date stock performance lagging behind the Sensex.

As of 3 December 2025, Hawkins Cookers has moved from a fair to an attractive valuation grade, indicating a shift in its perceived value. The company is currently considered undervalued, with a PE ratio of 36.59, an EV to EBITDA of 26.01, and a ROE of 30.48%. <BR><BR>In comparison to its peers, Hawkins Cookers' valuation metrics are competitive; for instance, Whirlpool India has a PE ratio of 36.94 and an EV to EBITDA of 19.06, while LG Electronics is priced higher at a PE of 49.64. Despite recent stock performance lagging behind the Sensex, with a year-to-date return of -13.64% compared to the Sensex's 8.92%, the strong ROCE of 59.20% suggests robust operational efficiency, reinforcing the attractiveness of Hawkins Cookers as an investment opportunity.

View full answer

How has been the historical performance of Hawkins Cookers?

03-Dec-2025

Hawkins Cookers has experienced strong financial growth, with net sales increasing from 673.87 Cr in Mar'20 to 1,115.76 Cr in Mar'25, and profit after tax rising from 54.22 Cr to 114.69 Cr during the same period. The company's earnings per share more than doubled to 216.81, reflecting improved operational efficiency and a solid financial position.

Answer:<BR>Hawkins Cookers has shown a positive trend in its financial performance over the past several years, with net sales increasing from 673.87 Cr in Mar'20 to 1,115.76 Cr in Mar'25. The total operating income has followed a similar upward trajectory, reaching 1,115.76 Cr in Mar'25, up from 652.84 Cr in Mar'19. The company's operating profit (PBDIT) has also improved significantly, rising from 90.33 Cr in Mar'19 to 168.06 Cr in Mar'25. Profit before tax has increased from 82.34 Cr in Mar'19 to 154.87 Cr in Mar'25, while profit after tax has grown from 54.22 Cr to 114.69 Cr over the same period. The earnings per share (EPS) have seen a substantial rise, reaching 216.81 in Mar'25 compared to 102.50 in Mar'19. On the balance sheet, total assets have increased from 297.02 Cr in Mar'20 to 583.72 Cr in Mar'25, with total liabilities also rising from 297.02 Cr to 583.72 Cr. The company has maintained a stable equity capital of 5.29 Cr throughout these years, while reserves have grown from 134.37 Cr in Mar'20 to 377.96 Cr in Mar'25. Cash flow from operating activities has fluctuated, with a notable increase to 101.00 Cr in Mar'25 from 65.00 Cr in Mar'20.<BR><BR>Breakdown:<BR>Hawkins Cookers has demonstrated consistent growth in net sales, which rose from 673.87 Cr in Mar'20 to 1,115.76 Cr in Mar'25, reflecting a strong demand for its products. The total operating income mirrored this growth, reaching 1,115.76 Cr in Mar'25. Operating profit (PBDIT) increased significantly from 90.33 Cr to 168.06 Cr during the same period, indicating improved operational efficiency. Profit before tax and profit after tax also showed positive trends, with figures rising from 82.34 Cr to 154.87 Cr and from 54.22 Cr to 114.69 Cr, respectively. The earnings per share (EPS) have more than doubled, reaching 216.81 in Mar'25. On the balance sheet, total assets and total liabilities increased in tandem, both reaching 583.72 Cr in Mar'25, while equity capital remained stable at 5.29 Cr. Reserves have grown significantly, indicating a strengthening financial position. Cash flow from operating activities has seen fluctuations but ended positively at 101.00 Cr in Mar'25, showcasing the company's ability to generate cash from its core operations.

View full answer

Is Hawkins Cookers technically bullish or bearish?

14-Nov-2025

As of November 13, 2025, the technical trend has shifted to mildly bearish, supported by bearish MACD and KST indicators, Dow Theory, and underperformance against the Sensex, despite some mildly bullish daily moving averages.

As of 13 November 2025, the technical trend has changed from mildly bullish to mildly bearish. The current technical stance is mildly bearish, driven primarily by the weekly and monthly MACD and KST indicators, both indicating a bearish sentiment. The Dow Theory also supports this bearish view on both time frames. Although the daily moving averages show a mildly bullish signal, the overall trend is overshadowed by the bearish signals from the weekly Bollinger Bands and the lack of strong signals from the RSI. The stock has underperformed compared to the Sensex across multiple time frames, further reinforcing the bearish outlook.

View full answer

Who are the top shareholders of the Hawkins Cookers?

17-Jul-2025

The top shareholders of Hawkins Cookers include promoters led by Neil Vasudeva with 15.83%, mutual funds at 13.13%, foreign institutional investors at 2.85%, and SBI Fund as the largest public shareholder with 9.42%. Individual investors collectively hold 22.04% of the shares.

The top shareholders of Hawkins Cookers include the promoters, who hold the majority of the shares. Notably, Neil Vasudeva is the promoter with the highest holding at 15.83%. Additionally, mutual funds collectively hold 13.13% through two schemes, while foreign institutional investors (FIIs) account for 2.85% with 15 different FIIs involved. The highest public shareholder is SBI Fund, which holds 9.42%. Individual investors also have a significant presence, holding 22.04% of the shares.

View full answer

When is the next results date for Hawkins Cookers?

06-Jun-2025

No Upcoming Board Meetings

Has Hawkins Cookers declared dividend?

06-Jun-2025

Yes, Hawkins Cookers Ltd has declared a dividend of 1200% (₹120 per share) with an ex-date of July 29, 2024. The company has shown positive total returns over various periods, particularly in the long term, despite recent short-term fluctuations.

Hawkins Cookers Ltd has declared a dividend.<BR><BR>Dividend Details:<BR>- Percentage announced: 1200%<BR>- Amount per share: 120 per share<BR>- Ex-date: Jul-29-2024<BR><BR>Dividend Yield: 1.53%.<BR><BR>Total Returns by Period:<BR>In the last 6 months, the price return was -7.46%, with a dividend return of 0%, resulting in a total return of -7.46%.<BR><BR>Over the past year, the price return was 10.19%, the dividend return was 1.62%, leading to a total return of 11.81%.<BR><BR>In the 2-year period, the price return was 22.25%, with a dividend return of 3.46%, culminating in a total return of 25.71%.<BR><BR>For the 3-year period, the price return was 48.3%, the dividend return was 5.58%, which resulted in a total return of 53.88%.<BR><BR>In the last 4 years, the price return was 32.43%, with a dividend return of 6.40%, giving a total return of 38.83%.<BR><BR>Over the past 5 years, the price return was 83.54%, the dividend return was 10.60%, resulting in a total return of 94.14%.<BR><BR>Overall, Hawkins Cookers has declared a significant dividend, and the total returns over various periods show a positive trend, particularly over the longer term, indicating strong performance despite recent fluctuations.

View full answer
iScoreScore
Click here to find our call on this stock
Strong Sell
Sell
Hold
Buy
Strong Buy

Dashboard

1

High Management Efficiency with a high ROE of 33.20%

 
2

The company is Net-Debt Free

 
3

Positive results in Jun 26

4

With ROE of 30.5, it has a Attractive valuation with a 9.7 Price to Book Value

5

Majority shareholders : Promoters

 
stock-summaryMojo Parameters

Mojo Parameters

Loading Valuation Snapshot...

Stock DNA

stock-summary
Industry

Electronics & Appliances

stock-summary
Market cap

INR 4,325 Cr (Small Cap)

stock-summary
P/E

32.00

stock-summary
Industry P/E

55

stock-summary
Dividend Yield

1.72%

stock-summary
Debt Equity

-0.36

stock-summary
Return on Equity

30.46%

stock-summary
Price to Book

9.66

Revenue and Profits:
Net Sales:
318 Cr
(Quarterly Results - Jun 2026)
Net Profit:
30 Cr
stock-summaryTotal Returns
Total Returns (Price + Dividend) stock-summary
Dividend Yield (1.72%)
TimePeriod
Price Return
Dividend Return
Total Return
3 Months
9.43%
1.84%
11.27%
6 Months
0%
0%
0.0%
1 Year
0%
0%
0.0%
2 Years
0%
0%
0.0%
3 Years
0%
0%
0.0%
4 Years
0%
0%
0.0%
5 Years
0%
0%
0.0%

Latest dividend: 140 per share ex-dividend date: Jul-22-2026

Risk Adjusted Returns v/s stock-summary
Returns Beta
Icon
Beta has not been calculated since enough price history is not available
stock-summaryNews & Corporate Actions

News

Announcements stock-summary

Icon
No announcement available

Corporate Actions stock-summary

stock-summary
BOARD MEETING

No Upcoming Board Meetings

stock-summary
DIVIDEND

Hawkins Cookers Ltd has declared 1400% dividend, ex-date: 22 Jul 26

stock-summary
SPLITS

No Splits history available

stock-summary
BONUS

No Bonus history available

stock-summary
RIGHTS

No Rights history available

stock-summaryKey Factors

Quality key factors stock-summary

Factor
Value
Sales Growth (5y)
10.21%
EBIT Growth (5y)
7.81%
EBIT to Interest (avg)
36.36
Debt to EBITDA (avg)
0.27
Net Debt to Equity (avg)
-0.36
Sales to Capital Employed (avg)
3.17
Tax Ratio
25.73%
Dividend Payout Ratio
59.94%
Pledged Shares
0
Institutional Holding
18.76%
ROCE (avg)
67.48%
ROE (avg)
33.20%

Valuation key factors

Factor
Value
P/E Ratio
32
Industry P/E
55
Price to Book Value
9.66
EV to EBIT
23.79
EV to EBITDA
21.96
EV to Capital Employed
14.59
EV to Sales
3.11
PEG Ratio
1.83
Dividend Yield
1.72%
ROCE (Latest)
58.92%
ROE (Latest)
30.46%

Technicals key factors

Indicator
Weekly
Monthly
MACD
Mildly Bearish
Mildly Bearish
RSI
No Signal
No Signal
Bollinger Bands
Mildly Bullish
Mildly Bullish
Moving Averages
Mildly Bullish (Daily)
KST
Bullish
Bearish
Dow Theory
No Trend
No Trend
OBV
No Trend
No Trend
stock-summary Technical Indicator Scale: Bearish, Mildly Bearish, Sideways, Mildly Bullish, Bullish  Turned 
stock-summaryShareholding
Shareholding Snapshot : Jun 2026stock-summary
Shareholding Compare (%holding) stock-summary
Majority shareholders

Promoters

Pledged Promoter Holdings

None

Mutual Funds

Held by 4 Schemes (12.63%)

FIIs

Held by 8 FIIs (2.74%)

Promoter with highest holding

Neil Vasudeva (15.83%)

Highest Public shareholder

Sbi Fund (9.24%)

Individual Investors Holdings

21.65%

stock-summaryFinancial
[
  {
    "link": "quarterly",
    "btn_text": "All Quarterly Results",
    "header": "Quarterly Results Snapshot (Standalone) - Jun'26 - YoY",
    "rhs": [
      {
        "prefix": "Net Sales ",
        "suffix": "YoY Growth in quarter ended Jun 2026 is 33.06% vs 5.07% in Jun 2025",
        "dir": 1
      },
      {
        "prefix": "Standalone Net Profit ",
        "suffix": "YoY Growth in quarter ended Jun 2026 is 17.12% vs 3.55% in Jun 2025",
        "dir": 1
      }
    ],
    "table": {
      "header": [
        "Jun'26",
        "Jun'25",
        "Change(%)"
      ],
      "body": [
        {
          "field": "Net Sales",
          "val1": "318.13",
          "val2": "239.08",
          "chgp": "33.06%",
          "chgp_class": "positive"
        },
        {
          "field": "Operating Profit (PBDIT) excl Other Income",
          "val1": "42.73",
          "val2": "34.99",
          "chgp": "22.12%",
          "chgp_class": "positive"
        },
        {
          "field": "Interest",
          "val1": "0.89",
          "val2": "0.75",
          "chgp": "18.67%",
          "chgp_class": "negative"
        },
        {
          "field": "Exceptional Items",
          "val1": "0.00",
          "val2": "0.00",
          "chgp": "",
          "chgp_class": "neutral"
        },
        {
          "field": "Standalone Net Profit",
          "val1": "30.38",
          "val2": "25.94",
          "chgp": "17.12%",
          "chgp_class": "positive"
        },
        {
          "field": "Operating Profit Margin (Excl OI)",
          "val1": "13.43%",
          "val2": "14.64%",
          "chgp": "-1.21%",
          "chgp_class": "negative"
        }
      ]
    }
  },
  {
    "link": "half-yearly",
    "btn_text": "All Half Yearly Results",
    "header": "Half Yearly Results Snapshot (Standalone) - Sep'25",
    "rhs": [
      {
        "prefix": "Net Sales ",
        "suffix": " Growth in half year ended Sep 2025 is 6.14% vs 10.19% in Sep 2024",
        "dir": -1
      },
      {
        "prefix": "Standalone Net Profit ",
        "suffix": " Growth in half year ended Sep 2025 is -2.11% vs 5.61% in Sep 2024",
        "dir": -1
      }
    ],
    "table": {
      "header": [
        "Sep'25",
        "Sep'24",
        "Change(%)"
      ],
      "body": [
        {
          "field": "Net Sales",
          "val1": "555.55",
          "val2": "523.40",
          "chgp": "6.14%",
          "chgp_class": "positive"
        },
        {
          "field": "Operating Profit (PBDIT) excl Other Income",
          "val1": "79.00",
          "val2": "78.96",
          "chgp": "0.05%",
          "chgp_class": "positive"
        },
        {
          "field": "Interest",
          "val1": "2.06",
          "val2": "1.68",
          "chgp": "22.62%",
          "chgp_class": "negative"
        },
        {
          "field": "Exceptional Items",
          "val1": "0.00",
          "val2": "0.00",
          "chgp": "",
          "chgp_class": "neutral"
        },
        {
          "field": "Standalone Net Profit",
          "val1": "57.89",
          "val2": "59.14",
          "chgp": "-2.11%",
          "chgp_class": "negative"
        },
        {
          "field": "Operating Profit Margin (Excl OI)",
          "val1": "14.22%",
          "val2": "15.09%",
          "chgp": "-0.87%",
          "chgp_class": "negative"
        }
      ]
    }
  },
  {
    "link": "nine-monthly",
    "btn_text": "All Nine Monthly Results",
    "header": "Nine Monthly Results Snapshot (Standalone) - Dec'25",
    "rhs": [
      {
        "prefix": "Net Sales ",
        "suffix": "YoY Growth in nine months ended Dec 2025 is 9.69% vs 8.26% in Dec 2024",
        "dir": 1
      },
      {
        "prefix": "Standalone Net Profit ",
        "suffix": "YoY Growth in nine months ended Dec 2025 is 13.78% vs 6.12% in Dec 2024",
        "dir": 1
      }
    ],
    "table": {
      "header": [
        "Dec'25",
        "Dec'24",
        "Change(%)"
      ],
      "body": [
        {
          "field": "Net Sales",
          "val1": "887.50",
          "val2": "809.10",
          "chgp": "9.69%",
          "chgp_class": "positive"
        },
        {
          "field": "Operating Profit (PBDIT) excl Other Income",
          "val1": "125.58",
          "val2": "107.51",
          "chgp": "16.81%",
          "chgp_class": "positive"
        },
        {
          "field": "Interest",
          "val1": "2.86",
          "val2": "2.36",
          "chgp": "21.19%",
          "chgp_class": "negative"
        },
        {
          "field": "Exceptional Items",
          "val1": "0.00",
          "val2": "0.00",
          "chgp": "",
          "chgp_class": "neutral"
        },
        {
          "field": "Standalone Net Profit",
          "val1": "91.41",
          "val2": "80.34",
          "chgp": "13.78%",
          "chgp_class": "positive"
        },
        {
          "field": "Operating Profit Margin (Excl OI)",
          "val1": "14.15%",
          "val2": "13.29%",
          "chgp": "0.86%",
          "chgp_class": "positive"
        }
      ]
    }
  },
  {
    "link": "annual",
    "btn_text": "All Annual Results",
    "header": "Annual Results Snapshot (Standalone) - Mar'26",
    "rhs": [
      {
        "prefix": "Net Sales ",
        "suffix": "YoY Growth in year ended Mar 2026 is 12.29% vs 8.94% in Mar 2025",
        "dir": 1
      },
      {
        "prefix": "Standalone Net Profit ",
        "suffix": "YoY Growth in year ended Mar 2026 is 14.39% vs 4.42% in Mar 2025",
        "dir": 1
      }
    ],
    "table": {
      "header": [
        "Mar'26",
        "Mar'25",
        "Change(%)"
      ],
      "body": [
        {
          "field": "Net Sales",
          "val1": "1,252.93",
          "val2": "1,115.76",
          "chgp": "12.29%",
          "chgp_class": "positive"
        },
        {
          "field": "Operating Profit (PBDIT) excl Other Income",
          "val1": "180.76",
          "val2": "154.53",
          "chgp": "16.97%",
          "chgp_class": "positive"
        },
        {
          "field": "Interest",
          "val1": "3.52",
          "val2": "2.90",
          "chgp": "21.38%",
          "chgp_class": "negative"
        },
        {
          "field": "Exceptional Items",
          "val1": "0.00",
          "val2": "0.00",
          "chgp": "",
          "chgp_class": "neutral"
        },
        {
          "field": "Standalone Net Profit",
          "val1": "131.19",
          "val2": "114.69",
          "chgp": "14.39%",
          "chgp_class": "positive"
        },
        {
          "field": "Operating Profit Margin (Excl OI)",
          "val1": "14.43%",
          "val2": "13.85%",
          "chgp": "0.58%",
          "chgp_class": "positive"
        }
      ]
    }
  }
]

Quarterly Results Snapshot (Standalone) - Jun'26 - YoYstock-summary

Jun'26
Jun'25
Change(%)
Net Sales
318.13
239.08
33.06%
Operating Profit (PBDIT) excl Other Income
42.73
34.99
22.12%
Interest
0.89
0.75
18.67%
Exceptional Items
0.00
0.00
Standalone Net Profit
30.38
25.94
17.12%
Operating Profit Margin (Excl OI)
13.43%
14.64%
-1.21%
Values in Rs Cr.
Direction Arrows
Net Sales

YoY Growth in quarter ended Jun 2026 is 33.06% vs 5.07% in Jun 2025

Direction Arrows
Standalone Net Profit

YoY Growth in quarter ended Jun 2026 is 17.12% vs 3.55% in Jun 2025

Half Yearly Results Snapshot (Standalone) - Sep'25stock-summary

Sep'25
Sep'24
Change(%)
Net Sales
555.55
523.40
6.14%
Operating Profit (PBDIT) excl Other Income
79.00
78.96
0.05%
Interest
2.06
1.68
22.62%
Exceptional Items
0.00
0.00
Standalone Net Profit
57.89
59.14
-2.11%
Operating Profit Margin (Excl OI)
14.22%
15.09%
-0.87%
Values in Rs Cr.
Direction Arrows
Net Sales

Growth in half year ended Sep 2025 is 6.14% vs 10.19% in Sep 2024

Direction Arrows
Standalone Net Profit

Growth in half year ended Sep 2025 is -2.11% vs 5.61% in Sep 2024

Nine Monthly Results Snapshot (Standalone) - Dec'25stock-summary

Dec'25
Dec'24
Change(%)
Net Sales
887.50
809.10
9.69%
Operating Profit (PBDIT) excl Other Income
125.58
107.51
16.81%
Interest
2.86
2.36
21.19%
Exceptional Items
0.00
0.00
Standalone Net Profit
91.41
80.34
13.78%
Operating Profit Margin (Excl OI)
14.15%
13.29%
0.86%
Values in Rs Cr.
Direction Arrows
Net Sales

YoY Growth in nine months ended Dec 2025 is 9.69% vs 8.26% in Dec 2024

Direction Arrows
Standalone Net Profit

YoY Growth in nine months ended Dec 2025 is 13.78% vs 6.12% in Dec 2024

Annual Results Snapshot (Standalone) - Mar'26stock-summary

Mar'26
Mar'25
Change(%)
Net Sales
1,252.93
1,115.76
12.29%
Operating Profit (PBDIT) excl Other Income
180.76
154.53
16.97%
Interest
3.52
2.90
21.38%
Exceptional Items
0.00
0.00
Standalone Net Profit
131.19
114.69
14.39%
Operating Profit Margin (Excl OI)
14.43%
13.85%
0.58%
Values in Rs Cr.
Direction Arrows
Net Sales

YoY Growth in year ended Mar 2026 is 12.29% vs 8.94% in Mar 2025

Direction Arrows
Standalone Net Profit

YoY Growth in year ended Mar 2026 is 14.39% vs 4.42% in Mar 2025

stock-summaryCompany CV
About Hawkins Cookers Ltd stock-summary
stock-summary
Hawkins Cookers Ltd
Small Cap
Electronics & Appliances
Established on February 25, 1959 by a professional manager-turned-entrepreneur when pressure cookers were virtually unknown in India, Hawkins Cookers Limited was formerly known as Pressure Cookers and Appliances Limited. Later, the Company name was changed from 'Pressure Cookers and Appliances Limited' to 'Hawkins Cookers Limited' in 1986. Hawkins has an extensive product range consisting of pressure cookers, cooker accessories, non-stick cookware, cuisinettes and satilon cookware.
Company Coordinates stock-summary
Company Details
F 101 Maker Tower, 10th Floor Cuffe Parade Mumbai Maharashtra : 400005
stock-summary
Tel: 91-22-22186607
stock-summary
ho@hawkinscookers.com
Registrar Details
Link Intime India Pvt Ltd, C-13 Pannalal Silk Compound, L B S Marg, Bhandup , Mumbai