
Compare Purple Finance with Similar Stocks
Dashboard
Weak Long Term Fundamental Strength with an average Return on Equity (ROE) of 0%
With a growth in Net Profit of 100%, the company declared Very Positive results in Mar 26
With ROE of -5.2, it has a Expensive valuation with a 3.1 Price to Book Value
82.25% of Promoter Shares are Pledged
Market Beating Performance
Stock DNA
Non Banking Financial Company (NBFC)
INR 392 Cr (Micro Cap)
NA (Loss Making)
21
0.00%
0.85
-5.18%
3.08
Total Returns (Price + Dividend) 
Purple Finance for the last several years.
Risk Adjusted Returns v/s
Returns Beta

News

Purple Finance Ltd is Rated Hold by MarketsMOJO
Purple Finance Ltd is rated 'Hold' by MarketsMOJO, with this rating last updated on 22 April 2026. However, the analysis and financial metrics discussed here reflect the stock’s current position as of 12 June 2026, providing investors with an up-to-date view of the company’s performance and outlook.
Read full news article
Purple Finance Ltd is Rated Hold by MarketsMOJO
Purple Finance Ltd is rated 'Hold' by MarketsMOJO, with this rating last updated on 22 Apr 2026. However, the analysis and financial metrics discussed below reflect the company’s current position as of 01 June 2026, providing investors with the most up-to-date view of the stock’s fundamentals, valuation, financial trends, and technical outlook.
Read full news article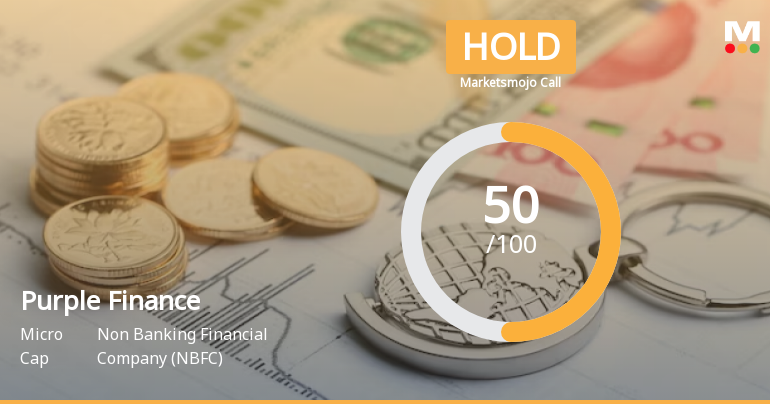
Purple Finance Ltd is Rated Hold by MarketsMOJO
Purple Finance Ltd is rated 'Hold' by MarketsMOJO. This rating was last updated on 22 Apr 2026, reflecting a shift from a previous 'Sell' rating. However, the analysis and financial metrics discussed here represent the stock's current position as of 21 May 2026, providing investors with the latest insights into its performance and outlook.
Read full news article Announcements
Board Meeting Outcome for Outcome Of The Finance Committee Meeting Held On June 15 2026
15-Jun-2026 | Source : BSEThe Finance Committee at their Meeting held on June 15 2026 approved the allotment of 12600000 (One Crore Twenty-Six Lakhs) Equity Share Warrants of the Company convertible into equivalent number of Equity Shares having the face value of INR 10/- each (Rupees Ten Only) fully paid-up at an issue price of INR 55/- (Rupees Fifty Five Only) (including a premium of INR 45/- per Warrant) per share aggregating to INR 693000000/- (Rupees Sixty-Nine Crores and Thirty Lakhs Only) on Preferential basis.
Compliances-Reg. 57 (1) - Certificate of interest payment/Principal in case of NCD
12-Jun-2026 | Source : BSEPlease find enclosed Certificate of Interest Payment.
Announcement under Regulation 30 (LODR)-Newspaper Publication
05-Jun-2026 | Source : BSEIntimation of Newspaper publication for reminder of re-lodgement of shares
Corporate Actions

No Upcoming Board Meetings

No Dividend history available

No Splits history available

No Bonus history available

Purple Finance Ltd has announced 3:14 rights issue, ex-date: 23 May 25
Quality key factors
Valuation key factors
Technicals key factors
 Technical Indicator Scale: Bearish, Mildly Bearish, Sideways, Mildly Bullish, Bullish Turned
 Shareholding Snapshot : Mar 2026
Shareholding Compare (%holding)
Non Institution
82.2468
Held by 0 Schemes
Held by 0 FIIs
Amitabh Chaturvedi (11.14%)
Intellect Money Finvest Private Limited (7.64%)
46.84%
Quarterly Results Snapshot (Standalone) - Mar'26 - QoQ

QoQ Growth in quarter ended Mar 2026 is 27.15% vs 20.45% in Dec 2025

QoQ Growth in quarter ended Mar 2026 is 100.00% vs 100.61% in Dec 2025
Half Yearly Results Snapshot (Standalone) - Sep'25
Growth in half year ended Sep 2025 is 267.66% vs 91.06% in Sep 2024
Growth in half year ended Sep 2025 is 33.98% vs -92.91% in Sep 2024
Nine Monthly Results Snapshot (Standalone) - Dec'25
YoY Growth in nine months ended Dec 2025 is 261.87% vs 145.51% in Dec 2024
YoY Growth in nine months ended Dec 2025 is 44.45% vs -34.76% in Dec 2024
Annual Results Snapshot (Standalone) - Mar'26
YoY Growth in year ended Mar 2026 is 223.71% vs 233.03% in Mar 2025
YoY Growth in year ended Mar 2026 is 58.59% vs -104.34% in Mar 2025
About Purple Finance Ltd

Company Coordinates


