Bajaj Housing

  • Market Cap: Large Cap
  • Industry: Housing Finance Company
  • ISIN: INE377Y01014
  • NSEID: BAJAJHFL
  • BSEID: 544252
INR
96.10
-0.25 (-0.26%)
BSENSE

Dec 05

BSE+NSE Vol: 70.01 lacs

  • Price Points
  • Score
  • Mojo Parameters
  • Total Return
  • News and Corporate Actions
  • Key factors
  • Shareholding
  • Financials
  • CompanyCV
stock-summaryPrice Point
High/Low

1Day

52 Week

Valuation
Technical
Day's Volume

CASH

70.01 lacs (-92.86%) Volume

Shareholding (Sep 2025)

FII

0.86%

Held by 68 FIIs

DII

0.07%

Held by 20 DIIs

Promoter

88.70%

Who are the top shareholders of the Bajaj Housing?

06-Jun-2025

The top shareholders of Bajaj Housing include Bajaj Finance Limited with an 88.75% stake, 19 mutual fund schemes holding 0.45%, 74 foreign institutional investors at 1.01%, and individual investors with 8.62%. There are no pledged promoter holdings or significant public shareholders.

The top shareholders of Bajaj Housing are primarily its promoters, with Bajaj Finance Limited holding the highest stake at 88.75%. Additionally, there are 19 mutual fund schemes collectively holding 0.45% of the shares, and 74 foreign institutional investors (FIIs) holding 1.01%. Individual investors account for 8.62% of the shareholding. Notably, there are no pledged promoter holdings or significant public shareholders.

Read More

When is the next results date for Bajaj Housing?

06-Jun-2025

No Upcoming Board Meetings

Has Bajaj Housing declared dividend?

06-Jun-2025

No Dividend History Available

Who are the peers of the Bajaj Housing?

16-Jul-2025

Bajaj Housing's peers include LIC Housing Fin., PNB Housing, Aadhar Housing Fin., and others, with varying management risks and growth rates. Notably, Bajaj Housing shows excellent growth and capital structure, while PNB Housing has the highest 1-year return at 38.17%.

Peers: The peers of Bajaj Housing are LIC Housing Fin., PNB Housing, Aadhar Hsg. Fin., Aptus Value Hou., Aavas Financiers, Home First Finan, Can Fin Homes, Sammaan Capital, INDIA SHELTE FIN, and Repco Home Fin.<BR><BR>Quality Snapshot: Excellent management risk is observed at Aptus Value Hou. and Can Fin Homes, while Good management risk is found at LIC Housing Fin., Aavas Financiers, Home First Finan, and INDIA SHELTE FIN. Average management risk is present at Bajaj Housing, PNB Housing, Aadhar Hsg. Fin., and Sammaan Capital. For Growth, Excellent growth is noted at Bajaj Housing, Home First Finan, and INDIA SHELTE FIN, while Good growth is seen at Aadhar Hsg. Fin., Aptus Value Hou., Aavas Financiers, and the rest. Below Average growth is reported for LIC Housing Fin. and PNB Housing. In terms of Capital Structure, Excellent capital structure is found at Bajaj Housing, Aadhar Hsg. Fin., Aptus Value Hou., Aavas Financiers, Home First Finan, INDIA SHELTE FIN, and Repco Home Fin, while Average capital structure is noted at LIC Housing Fin. and Good capital structure at Can Fin Homes.<BR><BR>Return Snapshot: The peer with the highest 1-year return is PNB Housing at 38.17%, while the lowest is LIC Housing Fin. at -21.02%. Bajaj Housing does not have a 1-year return available for comparison. Additionally, Aavas Financiers and Sammaan Capital have negative six-month returns.

Read More

What does Bajaj Housing do?

17-Jul-2025

Bajaj Housing Finance Ltd operates in the housing finance sector as a large-cap company, reporting net sales of ₹24,987 Cr and a net profit of ₹5,867 Cr for Q1 2025. Key metrics include a P/E ratio of 48.00 and a market cap of ₹100,905 Cr.

Overview: <BR>Bajaj Housing Finance Ltd operates in the housing finance industry and is categorized as a large-cap company.<BR><BR>History: <BR>Bajaj Housing Finance Ltd was originally incorporated as Bajaj Financial Solutions Limited in 2008. The company received its Certificate of Incorporation on June 13, 2008, and its Certificate for Commencement of Business on September 24, 2008. The most recent quarterly results reported net sales and net profit for the period ending March 2025.<BR><BR>Financial Snapshot: <BR>Net Sales: 24,987 Cr (Quarterly Results - Mar 2025) <BR>Net Profit: 5,867 Cr (Quarterly Results - Mar 2025) <BR>Market Cap: INR 100,905 Cr (Large Cap) <BR><BR>Key Metrics: <BR>P/E: 48.00 <BR>Industry P/E: 23 <BR>Dividend Yield: 0.00% <BR>Debt Equity: 4.11 <BR>Return on Equity: 10.84% <BR>Price to Book: 5.06 <BR><BR>Contact Details: <BR>No Company Details Available <BR>Registrar Address: Not available.

Read More

How big is Bajaj Housing?

24-Jul-2025

As of 24th July, Bajaj Housing Finance Ltd has a market capitalization of 101,696.00 Cr, with recent net sales of 9938.34 Cr and a net profit of 2263.60 Cr. The company's total assets are 1,02,764.61 Cr, and shareholder's funds amount to 19,946.80 Cr.

As of 24th July, Bajaj Housing Finance Ltd has a market capitalization of 101,696.00 Cr, categorizing it as a Large Cap company.<BR><BR>In the latest four quarters, Bajaj Housing reported Net Sales of 9938.34 Cr and a Net Profit of 2263.60 Cr.<BR><BR>The latest annual period for the balance sheet is March 2025, with Shareholder's Funds amounting to 19,946.80 Cr and Total Assets of 1,02,764.61 Cr.

Read More

How has been the historical performance of Bajaj Housing?

06-Nov-2025

Bajaj Housing has demonstrated significant growth over the past three years, with net sales increasing from 5,652.59 Cr in Mar'23 to 9,528.16 Cr in Mar'25, and profit after tax rising from 1,257.80 Cr to 2,162.90 Cr. However, total expenditure and interest expenses have also increased, impacting cash flow, which remains negative but has improved slightly.

Answer:<BR>The historical performance of Bajaj Housing shows significant growth in various financial metrics over the past three years.<BR><BR>Breakdown:<BR>Bajaj Housing's net sales increased from 5,652.59 Cr in Mar'23 to 9,528.16 Cr in Mar'25, demonstrating a strong upward trend. Other operating income also rose, reaching 47.45 Cr in Mar'25 from just 12.14 Cr in Mar'23. Total operating income followed suit, climbing from 5,664.73 Cr in Mar'23 to 9,575.61 Cr in Mar'25. Despite this growth, total expenditure excluding depreciation also increased, from 3,931.77 Cr in Mar'23 to 6,764.58 Cr in Mar'25, driven largely by other expenses which surged to 6,269.02 Cr. Operating profit (PBDIT) rose to 2,811.38 Cr in Mar'25 from 1,733.46 Cr in Mar'23, although interest expenses grew significantly from 3,211.32 Cr to 5,979.26 Cr in the same period. Profit before tax improved to 2,770.23 Cr in Mar'25, up from 1,700.06 Cr in Mar'23, leading to a profit after tax of 2,162.90 Cr in Mar'25 compared to 1,257.80 Cr in Mar'23. The company's equity capital increased to 8,328.15 Cr in Mar'25 from 6,712.16 Cr in Mar'24, while total liabilities rose to 1,02,764.61 Cr in Mar'25 from 81,776.15 Cr in Mar'24. Cash flow from operating activities remained negative but improved slightly, with a cash flow of -17,074 Cr in Mar'25 compared to -14,600 Cr in Mar'24. Overall, Bajaj Housing has shown robust growth in sales and profits, despite rising costs and interest expenses.

Read More

Are Bajaj Housing latest results good or bad?

07-Nov-2025

Bajaj Housing Finance's latest results are strong, with a net profit increase of 10.23% quarter-on-quarter and a net interest margin improvement to 30.87%. However, concerns about its high P/E ratio of 42x and a lower-than-average ROE of 10.84% may affect investor sentiment.

Bajaj Housing Finance's latest results can be considered good, reflecting solid growth and operational efficiency. In the second quarter of FY26, the company reported a net profit of ₹642.96 crores, which is a 10.23% increase compared to the previous quarter and a 17.84% increase year-on-year. Interest income also rose to ₹2,735.61 crores, marking a 4.94% increase quarter-on-quarter and a significant 14.10% increase year-on-year.<BR><BR>Additionally, the net interest margin improved to 30.87%, up 141 basis points from the previous quarter, indicating effective pricing strategies and favorable funding conditions. The operating profit before depreciation, interest, and tax reached its highest level in the company's recent history, showcasing strong operational leverage.<BR><BR>However, despite these positive results, there are concerns regarding the company's valuation. Bajaj Housing Finance trades at a premium P/E ratio of 42x, significantly higher than the sector average of 24x. Its return on equity (ROE) stands at 10.84%, which is below the average for its peers, raising questions about whether the current valuation is sustainable.<BR><BR>In summary, while the financial performance in the latest results is strong, the high valuation and relatively low ROE may temper enthusiasm among investors.

Read More

Should I buy, sell or hold Bajaj Housing?

08-Nov-2025

Is Bajaj Housing technically bullish or bearish?

19-Nov-2025

As of November 18, 2025, Bajaj Housing's technical trend has shifted to bearish, driven by a bearish MACD, moving averages, and underperformance against the Sensex, indicating moderate weakness in price momentum.

As of 18 November 2025, the technical trend has changed from mildly bearish to bearish. The current technical stance for Bajaj Housing is bearish with moderate strength. Key indicators driving this stance include a bearish MACD on the weekly timeframe, bearish moving averages on the daily timeframe, and mildly bearish signals from both Dow Theory and OBV on the weekly and monthly timeframes. The stock has also underperformed against the Sensex over various periods, indicating weakness in price momentum.

Read More

Why is Bajaj Housing falling/rising?

05-Dec-2025

As of 04-Dec, Bajaj Housing Finance Ltd's stock price is at Rs 96.35, down 0.72%, and has significantly underperformed over the past year and month. Despite strong long-term fundamentals, the stock is near its 52-week low and shows a bearish trend with decreased investor participation.

As of 04-Dec, Bajaj Housing Finance Ltd's stock price is falling, currently at Rs 96.35, reflecting a decrease of Rs 0.7 or 0.72%. The stock has underperformed significantly over various time frames, with a decline of 30.36% over the past year and 12.09% over the past month, while the benchmark Sensex has shown positive returns of 5.32% and 2.16% respectively during the same periods. <BR><BR>Today's performance indicates that the stock is close to its 52-week low, being only 1.5% away from Rs 94.9. Additionally, it has underperformed its sector by 0.84% today and is trading below all key moving averages (5-day, 20-day, 50-day, 100-day, and 200-day), which suggests a bearish trend. <BR><BR>Investor participation has also decreased, with a delivery volume of 1.7 crore shares on December 3, marking a significant drop of 59.13% compared to the 5-day average. This decline in trading activity further indicates a lack of confidence among investors. <BR><BR>Despite the company's strong long-term fundamentals, including a 27.65% CAGR growth in operating profits and positive results for the last four consecutive quarters, the stock's recent performance has been disappointing. The negative sentiment is compounded by the stock's substantial underperformance relative to broader market indices over both the short and long term, leading to its current downward trajectory.

Read More

Is Bajaj Housing overvalued or undervalued?

05-Dec-2025

As of December 4, 2025, Bajaj Housing is fairly valued with a PE ratio of 34.00, but has underperformed the Sensex with a year-to-date return of -24.4%, raising concerns about its growth prospects compared to peers like Bajaj Finance and Life Insurance.

As of 4 December 2025, Bajaj Housing's valuation grade has moved from expensive to fair, indicating a reassessment of its market position. The company appears to be fairly valued at this time. Key ratios include a PE Ratio of 34.00, an EV to EBIT of 18.63, and a ROE of 11.15%. <BR><BR>In comparison with its peers, Bajaj Finance is considered very expensive with a PE of 34.9, while Life Insurance stands out as very attractive with a PE of 10.85. Despite the fair valuation, Bajaj Housing has underperformed significantly against the Sensex, with a year-to-date return of -24.4% compared to the Sensex's 9.12%. This underperformance may suggest that the market is still cautious about the company's growth prospects.

Read More
iScoreScore
Click here to find our call on this stock
Strong Sell
Sell
Hold
Buy
Strong Buy

MarketsMojo — Loved in India, Now Global

The power of Mojo is now in 29 countries. Explore global equities with the same cutting-edge features you love.

Dashboard
1

Below par performance in long term as well as near term

  • Along with generating -34.45% returns in the last 1 year, the stock has also underperformed BSE500 in the last 3 years, 1 year and 3 months
stock-summaryMojo Parameters
Mojo Parameters
Loading Valuation Snapshot...
Stock DNA
stock-summary
Industry

Housing Finance Company

stock-summary
Market cap

INR 80,074 Cr (Large Cap)

stock-summary
P/E

34.00

stock-summary
Industry P/E

23

stock-summary
Dividend Yield

0.00%

stock-summary
Debt Equity

4.44

stock-summary
Return on Equity

11.15%

stock-summary
Price to Book

3.79

Revenue and Profits:
Net Sales:
2,736 Cr
(Quarterly Results - Sep 2025)
Net Profit:
643 Cr
stock-summaryTotal Returns
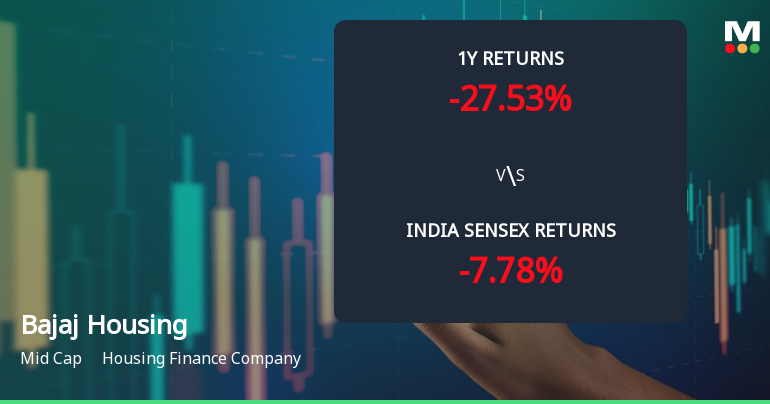
Total Returns (Price + Dividend) stock-summary
Dividend Yield (0%)
TimePeriod
Price Return
Dividend Return
Total Return
3 Months
-14.39%
0%
-14.39%
6 Months
-21.77%
0%
-21.77%
1 Year
-34.45%
0%
-34.45%
2 Years
0%
0%
0.0%
3 Years
0%
0%
0.0%
4 Years
0%
0%
0.0%
5 Years
0%
0%
0.0%

Bajaj Housing for the last several years.

Risk Adjusted Returns v/s stock-summary
Returns Beta
Icon
Beta has not been calculated since enough price history is not available
stock-summaryNews & Corporate Actions
News

Is Bajaj Housing overvalued or undervalued?

Current Valuation Metrics and Market Position

Bajaj Housing’s price-to-earnings (PE) ratio stands at 34.0, which is moderate within the housing finance sector but still on the higher side compared to some peers. Its price-to-book (P/B) ratio is 3.79, reflecting a premium over book value that investors are willing to pay for its growth prospects and asset quality. The enterprise value to EBITDA (EV/EBITDA) ratio is 18.54, indicating a valuation that is neither cheap nor excessively stretched.

Return on capital employed (ROCE) and return on equity (ROE) are 8.12% and 11.15% respectively, suggesting reasonable profitability but not exceptional returns relative to the valuation multiples. The absence of a dividend yield may also influence investor sentiment, as income-focu...

Read More
Announcements stock-summary

Please Find Attached Herewith Intimation With Respect To Proposed Sale Of Equity Shares Of The Company In The Open Market Held By The Promoters For Achieving Minimum Public Shareholding

01-Dec-2025 | Source : BSE

Intimation with respect to proposed sale of Equity shares of the Company by Promoters to achieve MPS.

Announcement under Regulation 30 (LODR)-Analyst / Investor Meet - Intimation

01-Dec-2025 | Source : BSE

Schedule of analyst/institutional investor meet

Announcement under Regulation 30 (LODR)-Issue of Securities

13-Nov-2025 | Source : BSE

Allotment of Secured Redeemable Non-Convertible Debentures on private placement basis.

Corporate Actions stock-summary
stock-summary
BOARD MEETING

No Upcoming Board Meetings

stock-summary
DIVIDEND

No Dividend history available

stock-summary
SPLITS

No Splits history available

stock-summary
BONUS

No Bonus history available

stock-summary
RIGHTS

No Rights history available

stock-summaryKey Factors
Quality key factors stock-summary
Factor
Value
Sales Growth (5y)
30.00%
EBIT Growth (5y)
27.65%
Net Debt to Equity (avg)
4.44
Institutional Holding
1.44%
ROE (avg)
10.49%
Valuation key factors
Factor
Value
P/E Ratio
34
Industry P/E
23
Price to Book Value
3.79
EV to EBIT
18.63
EV to EBITDA
18.54
EV to Capital Employed
1.51
EV to Sales
16.87
PEG Ratio
NA
Dividend Yield
NA
ROCE (Latest)
8.12%
ROE (Latest)
11.15%
Technicals key factors
Indicator
Weekly
Monthly
MACD
Bearish
RSI
No Signal
No Signal
Bollinger Bands
Bearish
Moving Averages
Bearish (Daily)
KST
Bearish
Dow Theory
Bearish
Bearish
OBV
Bearish
Bearish
stock-summary Technical Indicator Scale: Bearish, Mildly Bearish, Sideways, Mildly Bullish, Bullish  Turned 
stock-summaryShareholding
Shareholding Snapshot : Sep 2025stock-summary
Shareholding Compare (%holding) stock-summary
Majority shareholders

Promoters

Pledged Promoter Holdings

None

Mutual Funds

Held by 22 Schemes (0.33%)

FIIs

Held by 68 FIIs (0.86%)

Promoter with highest holding

Bajaj Finance Limited (88.7%)

Highest Public shareholder

None

Individual Investors Holdings

8.87%

stock-summaryFinancial
[
  {
    "link": "quarterly",
    "btn_text": "All Quarterly Results",
    "header": "Quarterly Results Snapshot (Standalone) - Sep'25 - QoQ",
    "rhs": [
      {
        "prefix": "Net Sales ",
        "suffix": "QoQ Growth in quarter ended Sep 2025 is 4.94% vs 4.33% in Jun 2025",
        "dir": 1
      },
      {
        "prefix": "Standalone Net Profit ",
        "suffix": "QoQ Growth in quarter ended Sep 2025 is 10.23% vs -0.58% in Jun 2025",
        "dir": 1
      }
    ],
    "table": {
      "header": [
        "Sep'25",
        "Jun'25",
        "Change(%)"
      ],
      "body": [
        {
          "field": "Net Sales",
          "val1": "2,735.61",
          "val2": "2,606.86",
          "chgp": "4.94%",
          "chgp_class": "positive"
        },
        {
          "field": "Operating Profit (PBDIT) excl Other Income",
          "val1": "2,502.17",
          "val2": "2,371.25",
          "chgp": "5.52%",
          "chgp_class": "positive"
        },
        {
          "field": "Interest",
          "val1": "1,657.96",
          "val2": "1,605.96",
          "chgp": "3.24%",
          "chgp_class": "negative"
        },
        {
          "field": "Exceptional Items",
          "val1": "0.00",
          "val2": "0.00",
          "chgp": "",
          "chgp_class": "neutral"
        },
        {
          "field": "Standalone Net Profit",
          "val1": "642.96",
          "val2": "583.30",
          "chgp": "10.23%",
          "chgp_class": "positive"
        },
        {
          "field": "Operating Profit Margin (Excl OI)",
          "val1": "91.47%",
          "val2": "90.96%",
          "chgp": "0.51%",
          "chgp_class": "positive"
        }
      ]
    }
  },
  {
    "link": "half-yearly",
    "btn_text": "All Half Yearly Results",
    "header": "Half Yearly Results Snapshot (Standalone) - Sep'25",
    "rhs": [
      {
        "prefix": "Net Sales ",
        "suffix": " Growth in half year ended Sep 2025 is 16.28% vs 25.57% in Sep 2024",
        "dir": -1
      },
      {
        "prefix": "Standalone Net Profit ",
        "suffix": " Growth in half year ended Sep 2025 is 19.26% vs 12.63% in Sep 2024",
        "dir": 1
      }
    ],
    "table": {
      "header": [
        "Sep'25",
        "Sep'24",
        "Change(%)"
      ],
      "body": [
        {
          "field": "Net Sales",
          "val1": "5,342.47",
          "val2": "4,594.34",
          "chgp": "16.28%",
          "chgp_class": "positive"
        },
        {
          "field": "Operating Profit (PBDIT) excl Other Income",
          "val1": "1,609.50",
          "val2": "1,357.23",
          "chgp": "18.59%",
          "chgp_class": "positive"
        },
        {
          "field": "Interest",
          "val1": "3,263.92",
          "val2": "2,912.41",
          "chgp": "12.07%",
          "chgp_class": "negative"
        },
        {
          "field": "Exceptional Items",
          "val1": "0.00",
          "val2": "0.00",
          "chgp": "",
          "chgp_class": "neutral"
        },
        {
          "field": "Standalone Net Profit",
          "val1": "1,226.26",
          "val2": "1,028.21",
          "chgp": "19.26%",
          "chgp_class": "positive"
        },
        {
          "field": "Operating Profit Margin (Excl OI)",
          "val1": "30.13%",
          "val2": "29.54%",
          "chgp": "0.59%",
          "chgp_class": "positive"
        }
      ]
    }
  },
  {
    "link": "nine-monthly",
    "btn_text": "All Nine Monthly Results",
    "header": "Nine Monthly Results Snapshot (Standalone) - Dec'24",
    "rhs": [
      {
        "prefix": "Net Sales ",
        "suffix": "YoY Growth in nine months ended Dec 2024 is 25.69% vs 5.64% in Dec 2023",
        "dir": 1
      },
      {
        "prefix": "Standalone Net Profit ",
        "suffix": "YoY Growth in nine months ended Dec 2024 is 16.77% vs 6.71% in Dec 2023",
        "dir": 1
      }
    ],
    "table": {
      "header": [
        "Dec'24",
        "Dec'23",
        "Change(%)"
      ],
      "body": [
        {
          "field": "Net Sales",
          "val1": "7,029.50",
          "val2": "5,592.80",
          "chgp": "25.69%",
          "chgp_class": "positive"
        },
        {
          "field": "Operating Profit (PBDIT) excl Other Income",
          "val1": "3,596.18",
          "val2": "2,902.55",
          "chgp": "23.90%",
          "chgp_class": "positive"
        },
        {
          "field": "Interest",
          "val1": "4,428.33",
          "val2": "3,413.31",
          "chgp": "29.74%",
          "chgp_class": "negative"
        },
        {
          "field": "Exceptional Items",
          "val1": "0.00",
          "val2": "0.00",
          "chgp": "",
          "chgp_class": "neutral"
        },
        {
          "field": "Standalone Net Profit",
          "val1": "1,576.23",
          "val2": "1,349.88",
          "chgp": "16.77%",
          "chgp_class": "positive"
        },
        {
          "field": "Operating Profit Margin (Excl OI)",
          "val1": "50.88%",
          "val2": "51.64%",
          "chgp": "-0.76%",
          "chgp_class": "negative"
        }
      ]
    }
  },
  {
    "link": "annual",
    "btn_text": "All Annual Results",
    "header": "Annual Results Snapshot (Standalone) - Mar'25",
    "rhs": [
      {
        "prefix": "Net Sales ",
        "suffix": "YoY Growth in year ended Mar 2025 is 25.71% vs 34.09% in Mar 2024",
        "dir": -1
      },
      {
        "prefix": "Standalone Net Profit ",
        "suffix": "YoY Growth in year ended Mar 2025 is 24.94% vs 37.64% in Mar 2024",
        "dir": -1
      }
    ],
    "table": {
      "header": [
        "Mar'25",
        "Mar'24",
        "Change(%)"
      ],
      "body": [
        {
          "field": "Net Sales",
          "val1": "9,528.16",
          "val2": "7,579.35",
          "chgp": "25.71%",
          "chgp_class": "positive"
        },
        {
          "field": "Operating Profit (PBDIT) excl Other Income",
          "val1": "2,811.03",
          "val2": "2,200.52",
          "chgp": "27.74%",
          "chgp_class": "positive"
        },
        {
          "field": "Interest",
          "val1": "5,979.26",
          "val2": "4,692.61",
          "chgp": "27.42%",
          "chgp_class": "negative"
        },
        {
          "field": "Exceptional Items",
          "val1": "0.00",
          "val2": "0.00",
          "chgp": "",
          "chgp_class": "neutral"
        },
        {
          "field": "Standalone Net Profit",
          "val1": "2,162.90",
          "val2": "1,731.22",
          "chgp": "24.94%",
          "chgp_class": "positive"
        },
        {
          "field": "Operating Profit Margin (Excl OI)",
          "val1": "29.50%",
          "val2": "29.03%",
          "chgp": "0.47%",
          "chgp_class": "positive"
        }
      ]
    }
  }
]
Quarterly Results Snapshot (Standalone) - Sep'25 - QoQstock-summary
Sep'25
Jun'25
Change(%)
Net Sales
2,735.61
2,606.86
4.94%
Operating Profit (PBDIT) excl Other Income
2,502.17
2,371.25
5.52%
Interest
1,657.96
1,605.96
3.24%
Exceptional Items
0.00
0.00
Standalone Net Profit
642.96
583.30
10.23%
Operating Profit Margin (Excl OI)
91.47%
90.96%
0.51%
Values in Rs Cr.
Direction Arrows
Net Sales

QoQ Growth in quarter ended Sep 2025 is 4.94% vs 4.33% in Jun 2025

Direction Arrows
Standalone Net Profit

QoQ Growth in quarter ended Sep 2025 is 10.23% vs -0.58% in Jun 2025

Half Yearly Results Snapshot (Standalone) - Sep'25stock-summary
Sep'25
Sep'24
Change(%)
Net Sales
5,342.47
4,594.34
16.28%
Operating Profit (PBDIT) excl Other Income
1,609.50
1,357.23
18.59%
Interest
3,263.92
2,912.41
12.07%
Exceptional Items
0.00
0.00
Standalone Net Profit
1,226.26
1,028.21
19.26%
Operating Profit Margin (Excl OI)
30.13%
29.54%
0.59%
Values in Rs Cr.
Direction Arrows
Net Sales

Growth in half year ended Sep 2025 is 16.28% vs 25.57% in Sep 2024

Direction Arrows
Standalone Net Profit

Growth in half year ended Sep 2025 is 19.26% vs 12.63% in Sep 2024

Nine Monthly Results Snapshot (Standalone) - Dec'24stock-summary
Dec'24
Dec'23
Change(%)
Net Sales
7,029.50
5,592.80
25.69%
Operating Profit (PBDIT) excl Other Income
3,596.18
2,902.55
23.90%
Interest
4,428.33
3,413.31
29.74%
Exceptional Items
0.00
0.00
Standalone Net Profit
1,576.23
1,349.88
16.77%
Operating Profit Margin (Excl OI)
50.88%
51.64%
-0.76%
Values in Rs Cr.
Direction Arrows
Net Sales

YoY Growth in nine months ended Dec 2024 is 25.69% vs 5.64% in Dec 2023

Direction Arrows
Standalone Net Profit

YoY Growth in nine months ended Dec 2024 is 16.77% vs 6.71% in Dec 2023

Annual Results Snapshot (Standalone) - Mar'25stock-summary
Mar'25
Mar'24
Change(%)
Net Sales
9,528.16
7,579.35
25.71%
Operating Profit (PBDIT) excl Other Income
2,811.03
2,200.52
27.74%
Interest
5,979.26
4,692.61
27.42%
Exceptional Items
0.00
0.00
Standalone Net Profit
2,162.90
1,731.22
24.94%
Operating Profit Margin (Excl OI)
29.50%
29.03%
0.47%
Values in Rs Cr.
Direction Arrows
Net Sales

YoY Growth in year ended Mar 2025 is 25.71% vs 34.09% in Mar 2024

Direction Arrows
Standalone Net Profit

YoY Growth in year ended Mar 2025 is 24.94% vs 37.64% in Mar 2024

stock-summaryCompany CV
About Bajaj Housing Finance Ltd stock-summary
stock-summary
Bajaj Housing Finance Ltd
Large Cap
Housing Finance Company
Bajaj Housing Finance Limited was originally incorporated as `Bajaj Financial Solutions Limited' at Pune, Maharashtra as a Public Limited Company, pursuant to a Certificate of Incorporation dated June 13, 2008, issued by the Registrar of Companies, Maharashtra at Pune and was granted its Certificate for Commencement of Business on September 24, 2008 by the RoC.
Company Coordinates stock-summary
Icon
No Company Details Available