
Compare PNB Housing with Similar Stocks
Dashboard
Positive results in Mar 26
- NET SALES(Q) Highest at Rs 2,181.53 cr
- PBDIT(Q) Highest at Rs 2,129.49 cr.
- OPERATING PROFIT TO NET SALES(Q) Highest at 97.61%
With ROE of 11.9, it has a Fair valuation with a 1.5 Price to Book Value
High Institutional Holdings at 60.69%
Market Beating performance in long term as well as near term
Stock DNA
Housing Finance Company
INR 29,147 Cr (Small Cap)
13.00
13
0.45%
3.70
11.92%
1.51
Total Returns (Price + Dividend) 
Latest dividend: 5 per share ex-dividend date: Aug-01-2025
Risk Adjusted Returns v/s
Returns Beta

News

Broad-Based Technical Strength Lifts PNB Housing Finance Ltd to 52-Week High of Rs 1132
With a decisive surge to Rs 1132 on 13 Jul 2026, PNB Housing Finance Ltd has reached a fresh 52-week high, marking a significant milestone in its price momentum. This rally is underpinned by a confluence of bullish technical indicators and sustained upward price action, even as the broader market trades with some caution.
Read full news article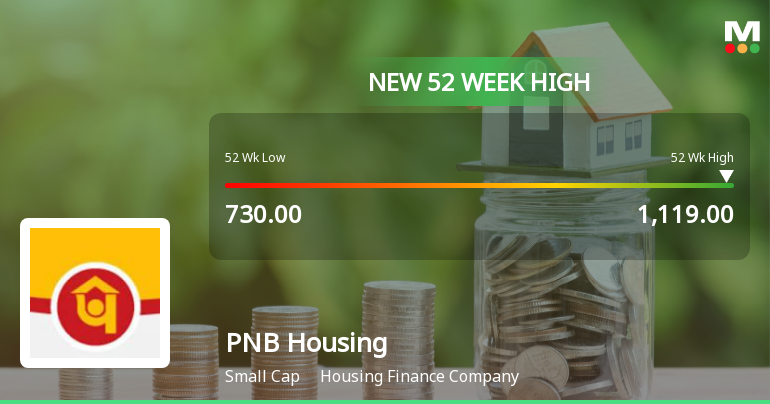
Broad-Based Technical Strength Lifts PNB Housing Finance Ltd to 52-Week High of Rs 1119
With a decisive surge to Rs 1119 on 10 Jul 2026, PNB Housing Finance Ltd has reached a fresh 52-week high, buoyed by a confluence of bullish technical indicators and sustained price momentum that outpaces its sector peers.
Read full news article
PNB Housing Finance Ltd is Rated Buy
PNB Housing Finance Ltd is rated 'Buy' by MarketsMOJO, with this rating last updated on 15 June 2026. However, the analysis and financial metrics presented here reflect the stock's current position as of 08 July 2026, providing investors with the latest insights into its performance and outlook.
Read full news article Announcements
PNB Housing Finance Limited - Updates
09-Dec-2019 | Source : NSEPNB Housing Finance Limited has informed the Exchange regarding 'Intimation of record date fixed for payment of interest of Non-convertible debentures'.
PNB Housing Finance Limited - Analysts/Institutional Investor Meet/Con. Call Updates
26-Nov-2019 | Source : NSEPNB Housing Finance Limited has informed the Exchange regarding Analysts/Institutional Investor Meet/Con. Call Updates - Intimation of schedule of the Non-Deal Road Show
PNB Housing Finance Limited - Updates
13-Nov-2019 | Source : NSEPNB Housing Finance Limited has informed the Exchange regarding 'timely payment of interest and principal on NCDs'.
Corporate Actions

No Upcoming Board Meetings

PNB Housing Finance Ltd has declared 50% dividend, ex-date: 01 Aug 25

No Splits history available

No Bonus history available

PNB Housing Finance Ltd has announced 29:54 rights issue, ex-date: 05 Apr 23
Quality key factors
Valuation key factors
Technicals key factors
 Technical Indicator Scale: Bearish, Mildly Bearish, Sideways, Mildly Bullish, Bullish Turned
 Shareholding Snapshot : Mar 2026
Shareholding Compare (%holding)
Mutual Funds
None
Held by 41 Schemes (31.11%)
Held by 182 FIIs (16.6%)
Punjab National Bank (28.04%)
Aditya Birla Sun Life Trustee Private Limited A/c - Aditya Birla Sun Life Large Cap Fund (3.68%)
9.01%
Quarterly Results Snapshot (Consolidated) - Mar'26 - YoY

YoY Growth in quarter ended Mar 2026 is 7.90% vs 11.71% in Mar 2025
YoY Growth in quarter ended Mar 2026 is 19.15% vs 25.30% in Mar 2025
Half Yearly Results Snapshot (Consolidated) - Sep'25

Growth in half year ended Sep 2025 is 13.57% vs 6.21% in Sep 2024
Growth in half year ended Sep 2025 is 23.56% vs 23.57% in Sep 2024
Nine Monthly Results Snapshot (Consolidated) - Dec'25
YoY Growth in nine months ended Dec 2025 is 12.04% vs 7.70% in Dec 2024
YoY Growth in nine months ended Dec 2025 is 18.02% vs 29.66% in Dec 2024
Annual Results Snapshot (Consolidated) - Mar'26
YoY Growth in year ended Mar 2026 is 10.95% vs 8.73% in Mar 2025
YoY Growth in year ended Mar 2026 is 18.34% vs 28.39% in Mar 2025
About PNB Housing Finance Ltd

Company Coordinates


