
Compare Ventive Hospital with Similar Stocks
Dashboard
Poor Management Efficiency with a low ROCE of 8.62%
- The company has been able to generate a Return on Capital Employed (avg) of 8.62% signifying low profitability per unit of total capital (equity and debt)
With ROCE of 10.1, it has a Expensive valuation with a 2.3 Enterprise value to Capital Employed
41.06% of Promoter Shares are Pledged
Below par performance in long term as well as near term
Stock DNA
Hotels & Resorts
INR 15,207 Cr (Small Cap)
35.00
37
0.00%
0.38
7.84%
2.75
Total Returns (Price + Dividend) 
Ventive Hospital for the last several years.
Risk Adjusted Returns v/s
Returns Beta

News
Ventive Hospitality Ltd is Rated Sell
Ventive Hospitality Ltd is rated 'Sell' by MarketsMOJO, with this rating last updated on 15 June 2026. However, the analysis and financial metrics discussed here reflect the stock's current position as of 19 June 2026, providing investors with the latest insights into the company’s performance and outlook.
Read full news article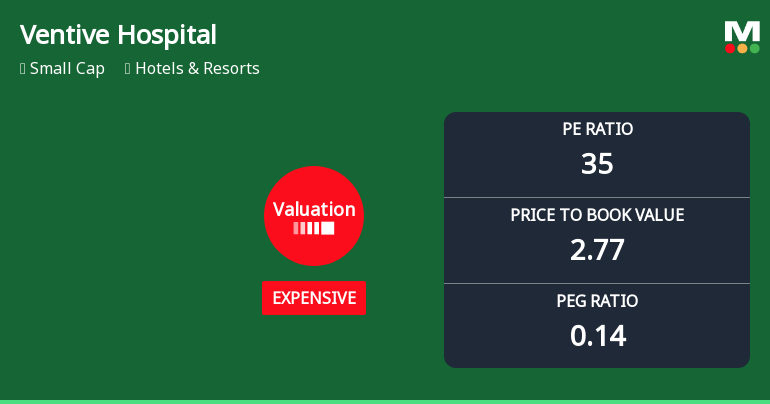
Ventive Hospitality Ltd Valuation Shifts Signal Price Attractiveness Concerns
Ventive Hospitality Ltd has seen a notable shift in its valuation parameters, moving from a fair to an expensive rating, reflecting increased price pressure amid mixed operational metrics and peer comparisons. The company’s price-to-earnings (P/E) ratio now stands at 35.32, significantly above several industry peers, prompting a downgrade in its Mojo Grade from Hold to Sell as of 15 June 2026.
Read full news article
Ventive Hospitality Ltd is Rated Sell
Ventive Hospitality Ltd is rated 'Sell' by MarketsMOJO, with this rating last updated on 01 June 2026. However, the analysis and financial metrics discussed here reflect the company’s current position as of 08 June 2026, providing investors with the most up-to-date insight into the stock’s fundamentals, valuation, financial trends, and technical outlook.
Read full news article Announcements
Announcement under Regulation 30 (LODR)-Analyst / Investor Meet - Intimation
08-Jun-2026 | Source : BSEIntimation about participation in the Investors Conference
Announcement under Regulation 30 (LODR)-Acquisition
03-Jun-2026 | Source : BSEFurther Investment in Soham Leisure Ventures Private Limited (Hilton Goa Resort) by Ventive Hospitality Limited.
Compliances-Reg.24(A)-Annual Secretarial Compliance
26-May-2026 | Source : BSESubmission of Annual Secretarial Compliance Report for the year ended March 31 2026
Corporate Actions

No Upcoming Board Meetings

No Dividend history available

No Splits history available

No Bonus history available

No Rights history available
Quality key factors
Valuation key factors
Technicals key factors
 Technical Indicator Scale: Bearish, Mildly Bearish, Sideways, Mildly Bullish, Bullish Turned
 Shareholding Snapshot : Mar 2026
Shareholding Compare (%holding)
Promoters
41.0628
Held by 5 Schemes (5.16%)
Held by 21 FIIs (1.42%)
Premsagar Infra Realty Private Limited (37.28%)
Quant Mutual Fund-quant Elss Tax Saver Fund (4.99%)
2.58%
Quarterly Results Snapshot (Consolidated) - Mar'26 - QoQ

QoQ Growth in quarter ended Mar 2026 is 13.61% vs 40.09% in Dec 2025
QoQ Growth in quarter ended Mar 2026 is 96.84% vs 121.82% in Dec 2025
Half Yearly Results Snapshot (Standalone) - Sep'25
Not Applicable: The company has declared_date for only one period
Not Applicable: The company has declared_date for only one period
Nine Monthly Results Snapshot (Standalone) - Dec'25
YoY Growth in nine months ended Dec 2025 is 16.07% vs 31.22% in Dec 2024

YoY Growth in nine months ended Dec 2025 is 108.40% vs 7.45% in Dec 2024
Annual Results Snapshot (Consolidated) - Mar'26
YoY Growth in year ended Mar 2026 is 53.36% vs 235.73% in Mar 2025
YoY Growth in year ended Mar 2026 is 253.85% vs -27.68% in Mar 2025
About Ventive Hospitality Ltd

Company Coordinates


