
Compare Indiqube Spaces with Similar Stocks
Dashboard
With HIgh Debt (Debt-Equity Ratio at 9.37 times)- the company has a Weak Long Term Fundamental Strength
- Poor long term growth as Net Sales has grown by an annual rate of 27.50% and Operating profit at 0% over the last 5 years
- The company is Net-Debt Free
With ROCE of 4.4, it has a Expensive valuation with a 1.6 Enterprise value to Capital Employed
Below par performance in long term as well as near term
Stock DNA
Diversified Commercial Services
INR 3,657 Cr (Small Cap)
NA (Loss Making)
32
0.00%
9.37
-20.66%
7.00
Total Returns (Price + Dividend) 
Indiqube Spaces for the last several years.
Risk Adjusted Returns v/s
Returns Beta

News
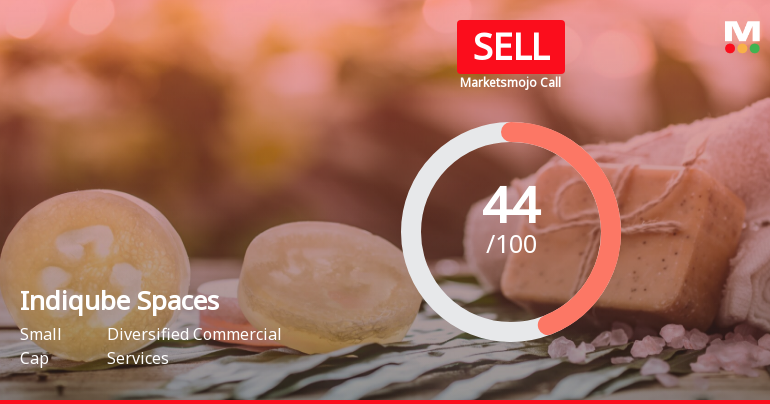
Indiqube Spaces Ltd is Rated Sell
Indiqube Spaces Ltd is rated 'Sell' by MarketsMOJO, with this rating last updated on 13 July 2026. However, the analysis and financial metrics discussed here reflect the stock's current position as of 25 July 2026, providing investors with an up-to-date view of the company’s fundamentals, valuation, financial trends, and technical outlook.
Read full news article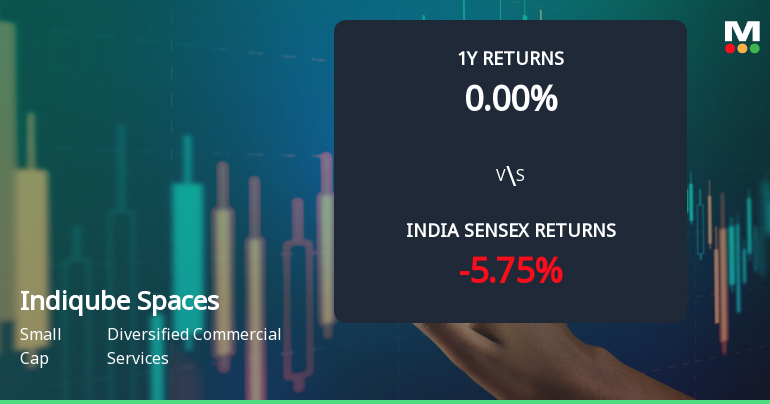
Indiqube Spaces Ltd Technical Momentum Shifts Amid Mixed Market Signals
Indiqube Spaces Ltd, a small-cap player in the diversified commercial services sector, has exhibited a notable shift in price momentum, moving from a sideways trend to a mildly bullish stance. Despite a recent upgrade in its technical outlook, the stock continues to face mixed signals from key indicators such as MACD, RSI, and moving averages, reflecting a complex market sentiment as it trades at ₹173.05, up 5.87% on the day.
Read full news article
Indiqube Spaces Ltd Technical Momentum Shifts Amid Market Pressure
Indiqube Spaces Ltd, a small-cap player in the diversified commercial services sector, has experienced a notable shift in its technical momentum, reflecting a complex interplay of bearish and mildly bullish signals. Despite a recent downgrade in its Mojo Grade to Sell from Strong Sell, the stock’s technical indicators reveal a sideways trend, underscoring investor caution amid broader market pressures.
Read full news article Announcements
Announcement under Regulation 30 (LODR)-Press Release / Media Release
15-Jul-2026 | Source : BSEPress Release
Compliances-Certificate under Reg. 74 (5) of SEBI (DP) Regulations 2018
08-Jul-2026 | Source : BSEIndiqube Spaces Limited submits the certificate under regulation 74(5) of SEBI (DP) Regulation 2018
Announcement under Regulation 30 (LODR)-Newspaper Publication
08-Jul-2026 | Source : BSENewspaper publication
Corporate Actions

No Upcoming Board Meetings

No Dividend history available

No Splits history available

No Bonus history available

No Rights history available
Quality key factors
Valuation key factors
Technicals key factors
 Technical Indicator Scale: Bearish, Mildly Bearish, Sideways, Mildly Bullish, Bullish Turned
 Shareholding Snapshot : Jun 2026
Shareholding Compare (%holding)
Promoters
None
Held by 9 Schemes (9.31%)
Held by 12 FIIs (2.16%)
Anshuman Das (21.81%)
Aravali Investment Holdings (19.14%)
2.44%
Quarterly Results Snapshot (Standalone) - Mar'26 - QoQ

QoQ Growth in quarter ended Mar 2026 is 2.95% vs 11.37% in Dec 2025
QoQ Growth in quarter ended Mar 2026 is -32.69% vs 42.85% in Dec 2025
Half Yearly Results Snapshot (Standalone) - Sep'25
Not Applicable: The company has declared_date for only one period
Not Applicable: The company has declared_date for only one period
Nine Monthly Results Snapshot (Standalone) - Dec'25
Not Applicable: The company has declared_date for only one period
Not Applicable: The company has declared_date for only one period
Annual Results Snapshot (Standalone) - Mar'26

YoY Growth in year ended Mar 2026 is 36.96% vs 27.54% in Mar 2025
YoY Growth in year ended Mar 2026 is 23.84% vs 59.12% in Mar 2025
About Indiqube Spaces Ltd

Company Coordinates


