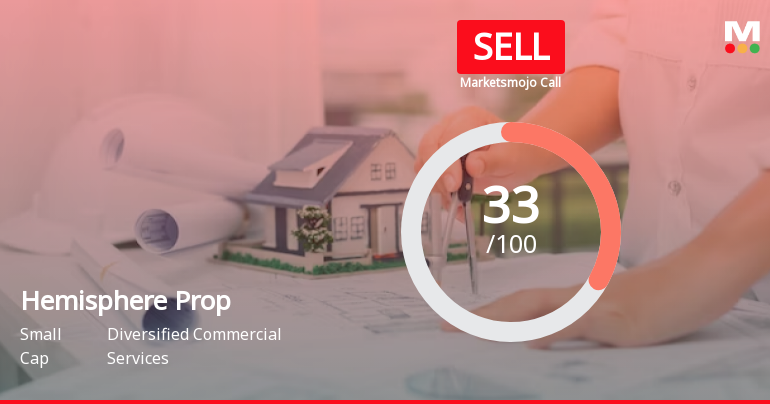
Hemisphere Prop

  • Market Cap: Small Cap
  • Industry: Diversified Commercial Services
  • ISIN: INE0AJG01018
  • NSEID: HEMIPROP
  • BSEID: 543242
INR
134.50
0.00 (0.00%)
BSENSE

Jul 30, 03:30 PM

BSE+NSE Vol: 1.46 lacs

  • Price Points
  • Score
  • Mojo Parameters
  • Total Return
  • News and Corporate Actions
  • Key factors
  • Shareholding
  • Financials
  • CompanyCV
stock-summaryPrice Point
High/Low

1Day

52 Week

Valuation
Technical
Day's Volume

CASH

1.46 lacs (-23.83%) Volume

Shareholding (Jun 2026)

FII

1.08%

Held by 19 FIIs

DII

0.29%

Held by 4 DIIs

Promoter

51.12%

Why is Hemisphere Properties India Ltd falling/rising?

31-Jul-2026

As of 30-Jul, Hemisphere Properties India Ltd is facing a stock price decline to 134.50 due to operating losses, weak fundamentals, and reduced investor interest. The company's negative financial metrics and declining profitability have contributed to this downward trend.

As of 30-Jul, Hemisphere Properties India Ltd is experiencing a decline in its stock price, currently at 134.50, down by 0.3 or 0.22%. This decrease can be attributed to several negative factors impacting the company's financial health and investor sentiment. <BR><BR>The company has reported operating losses and has shown weak long-term fundamental strength, with an annual growth rate of operating profit at -1.10% over the past five years. Additionally, the company's ability to service its debt is concerning, reflected in a poor EBIT to Interest ratio of -1.77. The latest financial results indicate flat performance, with a Debtors Turnover Ratio at its lowest of 6.25 times and a negative Profit Before Tax of Rs -4.72 crore.<BR><BR>Moreover, the stock has recorded a negative EBITDA of Rs -9.46 crore, and while it has generated a return of 4.43% over the past year, profits have significantly fallen by 49.2%. This decline in profitability, coupled with the stock trading at risky levels compared to its historical valuations, has likely contributed to the downward pressure on its price.<BR><BR>Investor participation is also waning, as evidenced by a 43.77% drop in delivery volume compared to the five-day average, indicating reduced interest from retail investors. Furthermore, institutional investors have decreased their stake by 0.62% in the previous quarter, holding only 1.37% of the company, which suggests a lack of confidence in the company's future performance.<BR><BR>Overall, these factors collectively explain the current decline in the stock price of Hemisphere Properties India Ltd.

View full answer

Should I buy, sell or hold Hemisphere Properties India Ltd?

30-Jul-2026

What does Hemisphere Prop do?

11-Jun-2026

Hemisphere Properties India Ltd is a small-cap real estate company focused on managing surplus land from the disinvestment of VSNL. As of March 2026, it reported net sales of 0 Cr and a net profit of -2 Cr, with a market cap of INR 4,001 Cr.

Overview:<BR>Hemisphere Properties India Ltd is a real estate company operating in the diversified commercial services industry, categorized as a small-cap entity.<BR><BR>History:<BR>Incorporated on 17 January 2005, Hemisphere Properties India Ltd was established to manage and transfer surplus land from the disinvestment of Videsh Sanchar Nigam Limited (VSNL), now known as Tata Communications Limited. The latest quarterly results reported net sales and profit for the period ending March 2026.<BR><BR>Financial Snapshot:<BR>Most recent Net Sales: 0 Cr (Quarterly Results - Mar 2026) <BR>Most recent Net Profit: -2 Cr (Quarterly Results - Mar 2026) <BR>Market-cap value: INR 4,001 Cr (Small Cap)<BR><BR>Key Metrics:<BR>P/E: N/A <BR>Industry P/E: 33 <BR>Dividend Yield: 0.00% <BR>Debt Equity: 0.14 <BR>Return on Equity: -2.59% <BR>Price to Book: 9.36 <BR><BR>Contact Details:<BR>Address: No 144 C-Wing Nirman Bhawan, Maulana Azad Road New Delhi Delhi : 110001 <BR>Tel: 91-11-2306 1325/1444 <BR>Email: info@hpil.co.in <BR>Website: http://www.hpil.co.in

View full answer

How big is Hemisphere Prop?

11-Jun-2026

As of 10th June, Hemisphere Properties India Ltd has a market capitalization of 4,001.00 Cr, with Net Sales of 1.00 Cr and a Net Profit loss of 11.22 Cr in the latest four quarters. Shareholder's Funds are 398.52 Cr and Total Assets amount to 1,089.55 Cr as of March 2025.

As of 10th June, Hemisphere Properties India Ltd has a market capitalization of 4,001.00 Cr, categorizing it as a Small Cap company.<BR><BR>In the latest four quarters, the company reported Net Sales of 1.00 Cr and a Net Profit loss of 11.22 Cr.<BR><BR>The latest annual period for the balance sheet is March 2025, with Shareholder's Funds amounting to 398.52 Cr and Total Assets of 1,089.55 Cr.

View full answer

Who are in the management team of Hemisphere Prop?

11-Jun-2026

The management team of Hemisphere Prop includes Thara Thara (Chairman & Managing Director), Lubna (Company Secretary & Compliance Officer), Diwakar Kumar Barnwal, Madhu Rani Teotia, G R Kanakavidu, Ravi Kumar Arora, Sunita Chandra, and Rajeev Kumar Das, all serving as directors.

The management team of Hemisphere Prop includes the following individuals:<BR><BR>1. **Thara Thara** - Chairman & Managing Director<BR>2. **Lubna** - Company Secretary & Compliance Officer<BR>3. **Diwakar Kumar Barnwal** - Director<BR>4. **Madhu Rani Teotia** - Director<BR>5. **G R Kanakavidu** - Independent Director<BR>6. **Ravi Kumar Arora** - Director<BR>7. **Sunita Chandra** - Independent Director<BR>8. **Rajeev Kumar Das** - Director<BR><BR>If you need more details about their roles or responsibilities, feel free to ask!

View full answer

Who are the peers of the Hemisphere Prop?

11-Jun-2026

Hemisphere Prop's peers include SIS, Indiabulls, Nirlon, Smartworks Cowor, CMS Info Systems, Quess Corp, Indiqube Spaces, Team Lease Serv., and AWFIS Space. Indiabulls and Smartworks Cowor show excellent management and growth, while Hemisphere Prop has below average management risk and growth, with a 1-year return of -6.02%.

Peers: The peers of Hemisphere Prop are SIS, Indiabulls, Nirlon, Smartworks Cowor, CMS Info Systems, Quess Corp, Indiqube Spaces, Team Lease Serv., and AWFIS Space.<BR><BR>Quality Snapshot: Excellent management risk is observed at Indiabulls, Smartworks Cowor, and CMS Info Systems, while Good management risk is found at Quess Corp, and Average management risk is seen at SIS, Nirlon, and Team Lease Serv. Below Average management risk is present at Hemisphere Prop and AWFIS Space, while Indiqube Spaces does not qualify. For growth, Excellent growth is noted at Indiabulls and Smartworks Cowor, while Below Average growth is found at Hemisphere Prop, SIS, Nirlon, CMS Info Systems, Quess Corp, Team Lease Serv., and AWFIS Space, with Indiqube Spaces again not qualifying. In terms of Capital Structure, Excellent capital structure is seen at CMS Info Systems, while Good capital structure is present at Indiabulls and Quess Corp, Average capital structure is found at SIS and Team Lease Serv., and Below Average capital structure is noted at Hemisphere Prop, Nirlon, and AWFIS Space, with Indiqube Spaces not qualifying.<BR><BR>Return Snapshot: Indiabulls has the highest 1-year return at 44.05%, while CMS Info Systems has the lowest at -41.45%. Hemisphere Prop's 1-year return of -6.02% is better than CMS Info Systems but worse than Indiabulls. Additionally, the six-month returns are negative for CMS Info Systems, AWFIS Space, and Indiqube Spaces.

View full answer

When is the next results date for Hemisphere Properties India Ltd?

12-May-2026

The next results date for Hemisphere Properties India Ltd is 20 May 2026.

The next results date for Hemisphere Properties India Ltd is scheduled for 20 May 2026.

View full answer

Is Hemisphere Prop technically bullish or bearish?

02-Dec-2025

As of December 1, 2025, Hemisphere Prop's technical trend has shifted to mildly bearish, driven by bearish signals from the weekly MACD and Bollinger Bands, despite mildly bullish daily moving averages.

As of 1 December 2025, the technical trend has changed from mildly bullish to mildly bearish. The current stance is mildly bearish, driven by the weekly MACD and Bollinger Bands both indicating bearish conditions, along with a mildly bearish KST on the weekly timeframe. The daily moving averages remain mildly bullish, but this is overshadowed by the overall bearish signals on the weekly and monthly charts. The lack of clear signals from the RSI and Dow Theory further supports a neutral outlook in those timeframes. Overall, the indicators suggest a weakening momentum for Hemisphere Prop.

View full answer

How has been the historical performance of Hemisphere Prop?

28-Oct-2025

Hemisphere Prop's historical performance shows fluctuating net sales, declining from INR 2.00 crore in Mar'23 to INR 0.91 crore in Mar'25, with consistent negative operating profits and significant losses before and after tax. Despite these challenges, the company achieved a net cash inflow of INR 50.00 crore in Mar'25 due to positive cash flow from investing and financing activities.

Answer:<BR>The historical performance of Hemisphere Prop shows a fluctuating trend in net sales and profitability over the years, with a notable increase in net sales from INR 0.52 crore in Mar'24 to INR 0.91 crore in Mar'25, although this is a decrease from INR 2.00 crore in Mar'23. The total operating income followed a similar pattern, reaching INR 0.91 crore in Mar'25, up from INR 0.52 crore in Mar'24, but down from INR 2.00 crore in Mar'23. The company has consistently reported high other expenses, peaking at INR 10.44 crore in Mar'25, which has contributed to negative operating profits, with an operating profit of -INR 3.07 crore in Mar'25 compared to -INR 5.81 crore in Mar'24. Profit before tax also remained negative, at -INR 9.28 crore in Mar'25, slightly improving from -INR 12.27 crore in Mar'24. Profit after tax showed a similar trend, with a loss of -INR 7.52 crore in Mar'25, an improvement from -INR 9.82 crore in Mar'24. The company's total assets increased to INR 1,089.55 crore in Mar'25 from INR 1,057.60 crore in Mar'24, while total liabilities also rose to INR 1,089.55 crore in Mar'25 from INR 1,057.60 crore in Mar'24. The cash flow from operating activities remained negative at -INR 16.00 crore in Mar'25, but cash flow from investing activities improved significantly to INR 25.00 crore, and financing activities contributed an inflow of INR 41.00 crore, resulting in a net cash inflow of INR 50.00 crore for the year.<BR><BR>Breakdown:<BR>Hemisphere Prop's financial performance over the years indicates a challenging environment, with net sales showing a decline from INR 2.00 crore in Mar'23 to INR 0.91 crore in Mar'25, despite a slight increase from the previous year. The company's total operating income mirrored this trend, while operating profits remained negative, reflecting ongoing financial struggles. The total expenditure, particularly other expenses, has been a significant burden, leading to substantial losses before and after tax. The total assets and liabilities have both seen an increase, indicating a growing balance sheet, but the negative cash flow from operating activities highlights ongoing operational challenges. However, the company managed to generate positive cash flow from investing and financing activities, resulting in a net cash inflow in Mar'25, suggesting some resilience in its financial strategy despite the losses.

View full answer

Are Hemisphere Prop latest results good or bad?

14-Aug-2025

Hemisphere Properties India's latest results show flat performance with no significant changes, leading to a 'Sell' recommendation from MarketsMOJO. While non-operating income increased, concerns about sustainability suggest potential investors should proceed with caution.

Hemisphere Properties India's latest results for the quarter ending December 2023 indicate a flat performance, with no significant changes in key metrics over the past three months. This stagnation has led to a 'Sell' recommendation from MarketsMOJO, suggesting that analysts have concerns about the company's outlook.<BR><BR>One notable point is the increase in non-operating income, which reached Rs 1.95 crore, the highest in the last five quarters. While this may seem positive, reliance on non-business income can raise questions about sustainability and long-term financial health.<BR><BR>Overall, the results appear to be more concerning than promising, and potential investors should carefully consider these factors before making any investment decisions regarding Hemisphere Properties India.

View full answer

Who are the top shareholders of the Hemisphere Prop?

17-Jul-2025

The top shareholders of Hemisphere Prop include the President of India with 51.12%, Panatone Finvest Limited at 9.7%, and individual investors holding 23.14%. Additionally, 6 mutual fund schemes own 0.09%, and 45 foreign institutional investors hold 1.24%, with no pledged promoter holdings reported.

The top shareholders of Hemisphere Prop include the President of India, who holds the largest share at 51.12%. Other significant shareholders are Panatone Finvest Limited, with a holding of 9.7%, and individual investors, who collectively own 23.14%. Additionally, the company has 6 mutual fund schemes holding a total of 0.09% and 45 foreign institutional investors (FIIs) with a combined holding of 1.24%. There are no pledged promoter holdings reported.

View full answer

Is Hemisphere Prop. overvalued or undervalued?

09-Jun-2025

Hemisphere Properties India Ltd. has been rated as risky due to its troubling financial ratios, including a PE ratio of -537.79 and an EV to EBITDA of -405.80, indicating overvaluation compared to peers and a significant year-to-date return of -17.03% against the Sensex's 5.57%.

As of 13 November 2020, the valuation grade for Hemisphere Properties India Ltd. has moved from does not qualify to risky, indicating a significant shift in its perceived financial health. The company appears to be overvalued, given its troubling financial ratios, including a PE ratio of -537.79, an EV to EBITDA of -405.80, and a Price to Book Value of 10.15. These figures suggest that the company's stock price is not justified by its earnings or asset value.<BR><BR>In comparison to its peers, Hemisphere Properties stands out with its extreme ratios, such as the PE ratio and EV to EBITDA, which are significantly worse than typical industry benchmarks. For instance, while Hemisphere's PEG ratio is at 0.00, indicating no growth expectations, other companies in the sector maintain more stable valuations. Additionally, the company's recent performance shows a 1-week return of 3.95%, outperforming the Sensex's 1.37%, but its year-to-date return of -17.03% starkly contrasts with the Sensex's 5.57%, reinforcing the notion that the stock is overvalued.

View full answer

Has Hemisphere Prop. declared dividend?

06-Jun-2025

No Dividend History Available

iScoreScore
Click here to find our call on this stock
Strong Sell
Sell
Hold
Buy
Strong Buy

Dashboard

1

With a Operating Losses, the company has a Weak Long Term Fundamental Strength

  • Poor long term growth as Operating profit has grown by an annual rate -1.10% of over the last 5 years
  • Company's ability to service its debt is weak with a poor EBIT to Interest (avg) ratio of -1.77
2

Flat results in Mar 26

3

Risky - Negative EBITDA

4

Falling Participation by Institutional Investors

stock-summaryMojo Parameters

Mojo Parameters

Loading Valuation Snapshot...

Stock DNA

stock-summary
Industry

Diversified Commercial Services

stock-summary
Market cap

INR 3,833 Cr (Small Cap)

stock-summary
P/E

NA (Loss Making)

stock-summary
Industry P/E

NA

stock-summary
Dividend Yield

0.00%

stock-summary
Debt Equity

0.14

stock-summary
Return on Equity

-2.59%

stock-summary
Price to Book

8.84

Revenue and Profits:
Net Sales:
0 Cr
(Quarterly Results - Mar 2026)
Net Profit:
-2 Cr
stock-summaryTotal Returns
Total Returns (Price + Dividend) stock-summary
Dividend Yield (0%)
TimePeriod
Price Return
Dividend Return
Total Return
3 Months
4.83%
0%
4.83%
6 Months
3.74%
0%
3.74%
1 Year
6.24%
0%
6.24%
2 Years
-38.23%
0%
-38.23%
3 Years
24.83%
0%
24.83%
4 Years
27.37%
0%
27.37%
5 Years
-5.55%
0%
-5.55%

Hemisphere Prop for the last several years.

Risk Adjusted Returns v/s stock-summary
Returns Beta
Icon
Beta has not been calculated since enough price history is not available
stock-summaryNews & Corporate Actions

News

Announcements stock-summary

Compliances-Certificate under Reg. 74 (5) of SEBI (DP) Regulations 2018

10-Jul-2026 | Source : BSE

Certificate under Regulation 74(5) of SEBI (Depositories and Participants) Regulations 2018 for the quarter ended on June 30 2026

Shareholder Meeting / Postal Ballot-Scrutinizers Report

30-Jun-2026 | Source : BSE

This is further to our intimation dated May 292026 enclosing the copy of postal ballot notice (Notice) for seeking approval of the Members of the Company by way of remote e-voting on resolution set out in the Notice. The remote e-voting process concluded at 5.00 p.m. (IST) on June 29 2026. Based on the report of the Scrutiniser we hereby inform that the Members of the Company have duly passed the said Resolutions with requisite majority. Accordingly please find enclosed: a) Voting results of the said Postal Ballot through remote e-voting in relation to the aforesaid businesses as required under Regulation 44 of the SEBI (Listing Obligations & Disclosure Requirements) Regulations 2015. b) The Scrutinizers Report dated June 29 2026 pursuant to Sections 108 and 110 of the Companies Act 2013 read with Rules 20 and 22 of the Companies (Management and Administration) Rules 2014.

Closure of Trading Window

22-Jun-2026 | Source : BSE

In compliance with SEBI (Prohibition of Insider Trading) Regulations 2015 and Code of Conduct to Regulate Monitor and Report Trading by Insider of Hemisphere Properties India Limited the Trading Window for dealing in securities of the Company is closed or all Directors/Officers/Designated Persons/Connected Persons of the Company from Wednesday July 01 2026 till 48 hours after the Financial Results for the period ended on June 30 2026 are declared. The date of the Board meeting to consider and approve the financial results for the abovementioned period will be communicated later and in due course.

Corporate Actions stock-summary

stock-summary
BOARD MEETING

No Upcoming Board Meetings

stock-summary
DIVIDEND

No Dividend history available

stock-summary
SPLITS

No Splits history available

stock-summary
BONUS

No Bonus history available

stock-summary
RIGHTS

No Rights history available

stock-summaryKey Factors

Quality key factors stock-summary

Factor
Value
Sales Growth (5y)
14.87%
EBIT Growth (5y)
-1.10%
EBIT to Interest (avg)
-1.77
Debt to EBITDA (avg)
Negative Net Debt
Net Debt to Equity (avg)
0.14
Sales to Capital Employed (avg)
0.00
Tax Ratio
17.38%
Dividend Payout Ratio
0
Pledged Shares
0
Institutional Holding
1.37%
ROCE (avg)
-3.17%
ROE (avg)
0

Valuation key factors

Factor
Value
P/E Ratio
NA (Loss Making)
Industry P/E
0
Price to Book Value
8.84
EV to EBIT
-405.36
EV to EBITDA
-411.79
EV to Capital Employed
7.85
EV to Sales
3895.49
PEG Ratio
NA
Dividend Yield
NA
ROCE (Latest)
-1.94%
ROE (Latest)
-2.59%

Technicals key factors

Indicator
Weekly
Monthly
MACD
Bearish
Bearish
RSI
Bearish
No Signal
Bollinger Bands
Mildly Bearish
Bearish
Moving Averages
Mildly Bullish (Daily)
KST
Bullish
Mildly Bullish
Dow Theory
No Trend
Mildly Bullish
OBV
Mildly Bullish
Mildly Bearish
stock-summary Technical Indicator Scale: Bearish, Mildly Bearish, Sideways, Mildly Bullish, Bullish  Turned 
stock-summaryShareholding
Shareholding Snapshot : Jun 2026stock-summary
Shareholding Compare (%holding) stock-summary
Majority shareholders

Promoters

Pledged Promoter Holdings

None

Mutual Funds

Held by 6 Schemes (0.09%)

FIIs

Held by 19 FIIs (1.08%)

Promoter with highest holding

President Of India (51.12%)

Highest Public shareholder

Tata Sons Private Limited (8.34%)

Individual Investors Holdings

24.58%

stock-summaryFinancial
[
  {
    "link": "quarterly",
    "btn_text": "All Quarterly Results",
    "header": "Quarterly Results Snapshot (Standalone) - Mar'26 - QoQ",
    "rhs": [
      {
        "prefix": "Net Sales ",
        "suffix": "QoQ Growth in quarter ended Mar 2026 is 0.00% vs 8.33% in Dec 2025",
        "dir": -1
      },
      {
        "prefix": "Standalone Net Profit ",
        "suffix": "QoQ Growth in quarter ended Mar 2026 is 46.91% vs 10.50% in Dec 2025",
        "dir": 1
      }
    ],
    "table": {
      "header": [
        "Mar'26",
        "Dec'25",
        "Change(%)"
      ],
      "body": [
        {
          "field": "Net Sales",
          "val1": "0.26",
          "val2": "0.26",
          "chgp": "",
          "chgp_class": "neutral"
        },
        {
          "field": "Operating Profit (PBDIT) excl Other Income",
          "val1": "-2.34",
          "val2": "-2.35",
          "chgp": "0.43%",
          "chgp_class": "positive"
        },
        {
          "field": "Interest",
          "val1": "2.34",
          "val2": "2.16",
          "chgp": "8.33%",
          "chgp_class": "negative"
        },
        {
          "field": "Exceptional Items",
          "val1": "0.00",
          "val2": "0.00",
          "chgp": "",
          "chgp_class": "neutral"
        },
        {
          "field": "Standalone Net Profit",
          "val1": "-1.72",
          "val2": "-3.24",
          "chgp": "46.91%",
          "chgp_class": "positive"
        },
        {
          "field": "Operating Profit Margin (Excl OI)",
          "val1": "-900.00%",
          "val2": "-903.85%",
          "chgp": "3.85%",
          "chgp_class": "positive"
        }
      ]
    }
  },
  {
    "link": "half-yearly",
    "btn_text": "All Half Yearly Results",
    "header": "Half Yearly Results Snapshot (Standalone) - Sep'25",
    "rhs": [
      {
        "prefix": "Net Sales ",
        "suffix": " Growth in half year ended Sep 2025 is 11.63% vs 72.00% in Sep 2024",
        "dir": -1
      },
      {
        "prefix": "Standalone Net Profit ",
        "suffix": " Growth in half year ended Sep 2025 is -51.21% vs -13.42% in Sep 2024",
        "dir": -1
      }
    ],
    "table": {
      "header": [
        "Sep'25",
        "Sep'24",
        "Change(%)"
      ],
      "body": [
        {
          "field": "Net Sales",
          "val1": "0.48",
          "val2": "0.43",
          "chgp": "11.63%",
          "chgp_class": "positive"
        },
        {
          "field": "Operating Profit (PBDIT) excl Other Income",
          "val1": "-4.78",
          "val2": "-4.53",
          "chgp": "-5.52%",
          "chgp_class": "negative"
        },
        {
          "field": "Interest",
          "val1": "3.51",
          "val2": "3.11",
          "chgp": "12.86%",
          "chgp_class": "negative"
        },
        {
          "field": "Exceptional Items",
          "val1": "0.00",
          "val2": "0.00",
          "chgp": "",
          "chgp_class": "neutral"
        },
        {
          "field": "Standalone Net Profit",
          "val1": "-6.26",
          "val2": "-4.14",
          "chgp": "-51.21%",
          "chgp_class": "negative"
        },
        {
          "field": "Operating Profit Margin (Excl OI)",
          "val1": "-995.83%",
          "val2": "-1,053.49%",
          "chgp": "57.66%",
          "chgp_class": "positive"
        }
      ]
    }
  },
  {
    "link": "nine-monthly",
    "btn_text": "All Nine Monthly Results",
    "header": "Nine Monthly Results Snapshot (Standalone) - Dec'25",
    "rhs": [
      {
        "prefix": "Net Sales ",
        "suffix": "YoY Growth in nine months ended Dec 2025 is 10.45% vs 76.32% in Dec 2024",
        "dir": -1
      },
      {
        "prefix": "Standalone Net Profit ",
        "suffix": "YoY Growth in nine months ended Dec 2025 is -47.06% vs -18.32% in Dec 2024",
        "dir": -1
      }
    ],
    "table": {
      "header": [
        "Dec'25",
        "Dec'24",
        "Change(%)"
      ],
      "body": [
        {
          "field": "Net Sales",
          "val1": "0.74",
          "val2": "0.67",
          "chgp": "10.45%",
          "chgp_class": "positive"
        },
        {
          "field": "Operating Profit (PBDIT) excl Other Income",
          "val1": "-7.13",
          "val2": "-6.84",
          "chgp": "-4.24%",
          "chgp_class": "negative"
        },
        {
          "field": "Interest",
          "val1": "5.67",
          "val2": "4.69",
          "chgp": "20.90%",
          "chgp_class": "negative"
        },
        {
          "field": "Exceptional Items",
          "val1": "0.00",
          "val2": "0.00",
          "chgp": "",
          "chgp_class": "neutral"
        },
        {
          "field": "Standalone Net Profit",
          "val1": "-9.50",
          "val2": "-6.46",
          "chgp": "-47.06%",
          "chgp_class": "negative"
        },
        {
          "field": "Operating Profit Margin (Excl OI)",
          "val1": "-963.51%",
          "val2": "-1,020.90%",
          "chgp": "57.39%",
          "chgp_class": "positive"
        }
      ]
    }
  },
  {
    "link": "annual",
    "btn_text": "All Annual Results",
    "header": "Annual Results Snapshot (Standalone) - Mar'26",
    "rhs": [
      {
        "prefix": "Net Sales ",
        "suffix": "YoY Growth in year ended Mar 2026 is 8.79% vs 75.00% in Mar 2025",
        "dir": -1
      },
      {
        "prefix": "Standalone Net Profit ",
        "suffix": "YoY Growth in year ended Mar 2026 is -49.20% vs 23.42% in Mar 2025",
        "dir": -1
      }
    ],
    "table": {
      "header": [
        "Mar'26",
        "Mar'25",
        "Change(%)"
      ],
      "body": [
        {
          "field": "Net Sales",
          "val1": "0.99",
          "val2": "0.91",
          "chgp": "8.79%",
          "chgp_class": "positive"
        },
        {
          "field": "Operating Profit (PBDIT) excl Other Income",
          "val1": "-9.49",
          "val2": "-9.99",
          "chgp": "5.01%",
          "chgp_class": "positive"
        },
        {
          "field": "Interest",
          "val1": "8.01",
          "val2": "6.09",
          "chgp": "31.53%",
          "chgp_class": "negative"
        },
        {
          "field": "Exceptional Items",
          "val1": "0.00",
          "val2": "0.00",
          "chgp": "",
          "chgp_class": "neutral"
        },
        {
          "field": "Standalone Net Profit",
          "val1": "-11.22",
          "val2": "-7.52",
          "chgp": "-49.20%",
          "chgp_class": "negative"
        },
        {
          "field": "Operating Profit Margin (Excl OI)",
          "val1": "-958.59%",
          "val2": "-1,097.80%",
          "chgp": "139.21%",
          "chgp_class": "positive"
        }
      ]
    }
  }
]

Quarterly Results Snapshot (Standalone) - Mar'26 - QoQstock-summary

Mar'26
Dec'25
Change(%)
Net Sales
0.26
0.26
Operating Profit (PBDIT) excl Other Income
-2.34
-2.35
0.43%
Interest
2.34
2.16
8.33%
Exceptional Items
0.00
0.00
Standalone Net Profit
-1.72
-3.24
46.91%
Operating Profit Margin (Excl OI)
-900.00%
-903.85%
3.85%
Values in Rs Cr.
Direction Arrows
Net Sales

QoQ Growth in quarter ended Mar 2026 is 0.00% vs 8.33% in Dec 2025

Direction Arrows
Standalone Net Profit

QoQ Growth in quarter ended Mar 2026 is 46.91% vs 10.50% in Dec 2025

Half Yearly Results Snapshot (Standalone) - Sep'25stock-summary

Sep'25
Sep'24
Change(%)
Net Sales
0.48
0.43
11.63%
Operating Profit (PBDIT) excl Other Income
-4.78
-4.53
-5.52%
Interest
3.51
3.11
12.86%
Exceptional Items
0.00
0.00
Standalone Net Profit
-6.26
-4.14
-51.21%
Operating Profit Margin (Excl OI)
-995.83%
-1,053.49%
57.66%
Values in Rs Cr.
Direction Arrows
Net Sales

Growth in half year ended Sep 2025 is 11.63% vs 72.00% in Sep 2024

Direction Arrows
Standalone Net Profit

Growth in half year ended Sep 2025 is -51.21% vs -13.42% in Sep 2024

Nine Monthly Results Snapshot (Standalone) - Dec'25stock-summary

Dec'25
Dec'24
Change(%)
Net Sales
0.74
0.67
10.45%
Operating Profit (PBDIT) excl Other Income
-7.13
-6.84
-4.24%
Interest
5.67
4.69
20.90%
Exceptional Items
0.00
0.00
Standalone Net Profit
-9.50
-6.46
-47.06%
Operating Profit Margin (Excl OI)
-963.51%
-1,020.90%
57.39%
Values in Rs Cr.
Direction Arrows
Net Sales

YoY Growth in nine months ended Dec 2025 is 10.45% vs 76.32% in Dec 2024

Direction Arrows
Standalone Net Profit

YoY Growth in nine months ended Dec 2025 is -47.06% vs -18.32% in Dec 2024

Annual Results Snapshot (Standalone) - Mar'26stock-summary

Mar'26
Mar'25
Change(%)
Net Sales
0.99
0.91
8.79%
Operating Profit (PBDIT) excl Other Income
-9.49
-9.99
5.01%
Interest
8.01
6.09
31.53%
Exceptional Items
0.00
0.00
Standalone Net Profit
-11.22
-7.52
-49.20%
Operating Profit Margin (Excl OI)
-958.59%
-1,097.80%
139.21%
Values in Rs Cr.
Direction Arrows
Net Sales

YoY Growth in year ended Mar 2026 is 8.79% vs 75.00% in Mar 2025

Direction Arrows
Standalone Net Profit

YoY Growth in year ended Mar 2026 is -49.20% vs 23.42% in Mar 2025

stock-summaryCompany CV
About Hemisphere Properties India Ltd stock-summary
stock-summary
Hemisphere Properties India Ltd
Small Cap
Diversified Commercial Services
Hemisphere Properties India Limited (HPIL), a Central Public Sector Enterprise (CPSE) was incorporated on 17 January, 2005 as Real Estate Company to transfer and hive off the land set aside as Surplus Land at the time of disinvestment of Videsh Sanchar Nigam Limited (VSNL) which is presently known as Tata Communications Limited.
Company Coordinates stock-summary
Company Details
No 144 C-Wing Nirman Bhawan, Maulana Azad Road New Delhi Delhi : 110001
stock-summary
Tel: 91-11-2306 1325/1444
stock-summary
info@hpil.co.in
Registrar Details