
Compare Shringar House with Similar Stocks
Dashboard
Strong ability to service debt as the company has a low Debt to EBITDA ratio of 1.19 times
Healthy long term growth as Net Sales has grown by an annual rate of 29.80% and Operating profit at 90.85%
With a growth in Net Profit of 12.88%, the company declared Very Positive results in Mar 26
With ROE of 17, it has a Attractive valuation with a 3.1 Price to Book Value
Increasing Participation by Institutional Investors
Stock DNA
Gems, Jewellery And Watches
INR 2,080 Cr (Small Cap)
18.00
48
0.00%
0.09
17.04%
3.06
Total Returns (Price + Dividend) 
Shringar House for the last several years.
Risk Adjusted Returns v/s
Returns Beta

News

Shringar House of Mangalsutra Ltd is Rated Buy
Shringar House of Mangalsutra Ltd is rated Buy by MarketsMOJO, with this rating last updated on 15 June 2026. While the rating change occurred on that date, the analysis and financial metrics discussed here reflect the company’s current position as of 25 June 2026, providing investors with the latest insights into its performance and outlook.
Read full news article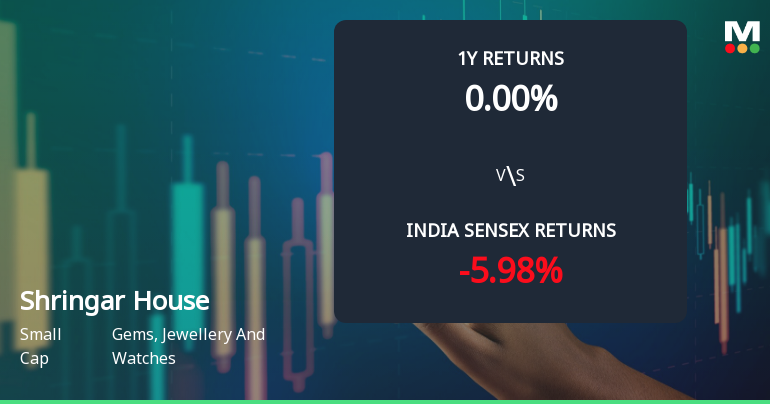
Technical Momentum Shift Boosts Shringar House of Mangalsutra Ltd’s Outlook
Shringar House of Mangalsutra Ltd, a small-cap player in the Gems, Jewellery and Watches sector, has exhibited a notable shift in its technical momentum, moving from a sideways trend to a mildly bullish stance. This change is underscored by improvements in key technical indicators such as the MACD and Bollinger Bands on the weekly chart, alongside a recent upgrade in its Mojo Grade from Hold to Buy, signalling growing investor confidence.
Read full news article
Shringar House of Mangalsutra Ltd is Rated Hold
Shringar House of Mangalsutra Ltd is rated 'Hold' by MarketsMOJO, with this rating last updated on 08 June 2026. However, the analysis and financial metrics discussed here reflect the company’s current position as of 14 June 2026, providing investors with the latest insights into its performance and outlook.
Read full news article Announcements
Closure of Trading Window
23-Jun-2026 | Source : BSEAs per attached pdf
Announcement under Regulation 30 (LODR)-Change in Management
19-Jun-2026 | Source : BSEAs per attached PDF
Board Meeting Outcome for Outcome Of Board Meeting Held On Friday June 19 2026 - Ref: Regulation 30 Of The SEBI (Listing Obligations And Disclosure Requirements) Regulations 2015 (Listing Regulations)
19-Jun-2026 | Source : BSEPursuant to Regulation 30 read with Schedule III of the Securities and Exchange Board of India (Listing Obligations and Disclosure Requirements) Regulations 2015 as amended we would like to inform you that the Board of Directors of Shringar House of Mangalsutra Limited (the Company) at its meeting held today i.e. Friday June 19 2026 has inter-alia considered and approved: 1. Appointment M/S J F Jain & Co. Chartered Accountants as Internal Auditor for FY 2026-27; Disclosures required under Regulation 30 read with Schedule III of the SEBI Listing Regulations read along with SEBI Master Circular no. HO/49/14/14(7)2025-CFDPOD2/I/3762/2026 dated January 30 2026Annexure A. The Board Meeting commenced at 3.30 p.m. IST and concluded 04:20 p.m. IST. This intimation is also being uploaded on the Companys website at www.shringar.ms We request you to take the same on record.
Corporate Actions

No Upcoming Board Meetings

No Dividend history available

No Splits history available

No Bonus history available

No Rights history available
Quality key factors
Valuation key factors
Technicals key factors
 Technical Indicator Scale: Bearish, Mildly Bearish, Sideways, Mildly Bullish, Bullish Turned
 Shareholding Snapshot : Mar 2026
Shareholding Compare (%holding)
Promoters
None
Held by 0 Schemes
Held by 26 FIIs (5.78%)
Chetan Natvarlal Thadeshwar (41.76%)
Thakkar Vardhilal Shivrambhai (1.61%)
11.11%
Quarterly Results Snapshot (Standalone) - Mar'26 - QoQ

QoQ Growth in quarter ended Mar 2026 is 10.12% vs 24.60% in Dec 2025
QoQ Growth in quarter ended Mar 2026 is 12.88% vs 31.86% in Dec 2025
Half Yearly Results Snapshot (Standalone) - Sep'25
Not Applicable: The company has declared_date for only one period
Not Applicable: The company has declared_date for only one period
Nine Monthly Results Snapshot (Standalone) - Dec'25
Not Applicable: The company has declared_date for only one period
Not Applicable: The company has declared_date for only one period
Annual Results Snapshot (Standalone) - Mar'26

YoY Growth in year ended Mar 2026 is 57.07% vs 29.80% in Mar 2025
YoY Growth in year ended Mar 2026 is 88.99% vs 96.43% in Mar 2025
About Shringar House of Mangalsutra Ltd

Company Coordinates


