
Compare Shringar House with Similar Stocks
Dashboard
Strong ability to service debt as the company has a low Debt to EBITDA ratio of 1.19 times
Healthy long term growth as Net Sales has grown by an annual rate of 29.80% and Operating profit at 90.85%
With a growth in Net Profit of 12.88%, the company declared Very Positive results in Mar 26
With ROE of 17, it has a Attractive valuation with a 3.2 Price to Book Value
Stock DNA
Gems, Jewellery And Watches
INR 2,152 Cr (Small Cap)
19.00
52
0.00%
0.09
17.04%
3.21
Total Returns (Price + Dividend) 
Shringar House for the last several years.
Risk Adjusted Returns v/s
Returns Beta

News
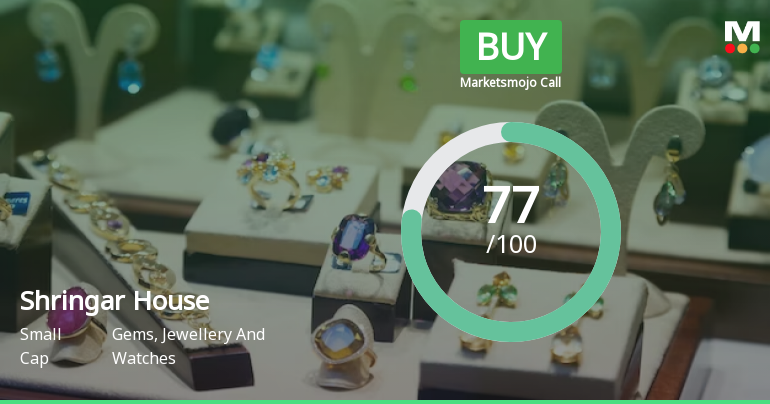
Shringar House of Mangalsutra Ltd is Rated Buy
Shringar House of Mangalsutra Ltd is rated 'Buy' by MarketsMOJO, with this rating last updated on 15 June 2026. However, the analysis and financial metrics discussed here reflect the stock's current position as of 17 July 2026, providing investors with the latest insights into its performance and outlook.
Read full news article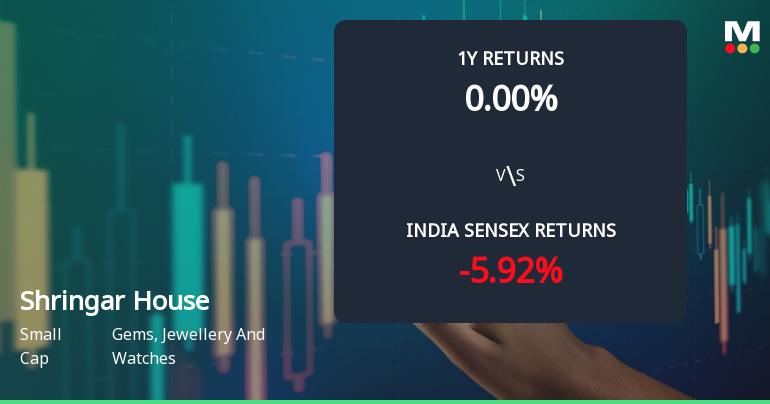
Technical Momentum Shift Boosts Shringar House of Mangalsutra Ltd’s Outlook
Shringar House of Mangalsutra Ltd has witnessed a notable shift in its technical momentum, upgrading from a mildly bullish to a bullish stance as of mid-June 2026. This change is underpinned by positive signals across key technical indicators including MACD, Bollinger Bands, and moving averages, signalling renewed investor confidence in this small-cap gem within the Gems, Jewellery and Watches sector.
Read full news article
Shringar House of Mangalsutra Ltd is Rated Buy
Shringar House of Mangalsutra Ltd is rated Buy by MarketsMOJO, with this rating last updated on 15 June 2026. While the rating change occurred on that date, the analysis and financial metrics discussed here reflect the company’s current position as of 06 July 2026, providing investors with the latest insights into the stock’s fundamentals, valuation, financial trends, and technical outlook.
Read full news article Announcements
Compliances-Certificate under Reg. 74 (5) of SEBI (DP) Regulations 2018
07-Jul-2026 | Source : BSEAs per attached PDF
Announcement under Regulation 30 (LODR)-Change in Management
26-Jun-2026 | Source : BSEAs per attached PDF
Closure of Trading Window
23-Jun-2026 | Source : BSEAs per attached pdf
Corporate Actions

No Upcoming Board Meetings

No Dividend history available

No Splits history available

No Bonus history available

No Rights history available
Quality key factors
Valuation key factors
Technicals key factors
 Technical Indicator Scale: Bearish, Mildly Bearish, Sideways, Mildly Bullish, Bullish Turned
 Shareholding Snapshot : Jun 2026
Shareholding Compare (%holding)
Promoters
None
Held by 0 Schemes
Held by 15 FIIs (2.93%)
Chetan Natvarlal Thadeshwar (41.76%)
Kotak Mahindra Life Insurance Company Ltd. (1.84%)
11.97%
Quarterly Results Snapshot (Standalone) - Mar'26 - QoQ

QoQ Growth in quarter ended Mar 2026 is 10.12% vs 24.60% in Dec 2025
QoQ Growth in quarter ended Mar 2026 is 12.88% vs 31.86% in Dec 2025
Half Yearly Results Snapshot (Standalone) - Sep'25
Not Applicable: The company has declared_date for only one period
Not Applicable: The company has declared_date for only one period
Nine Monthly Results Snapshot (Standalone) - Dec'25
Not Applicable: The company has declared_date for only one period
Not Applicable: The company has declared_date for only one period
Annual Results Snapshot (Standalone) - Mar'26

YoY Growth in year ended Mar 2026 is 57.07% vs 29.80% in Mar 2025
YoY Growth in year ended Mar 2026 is 88.99% vs 96.43% in Mar 2025
About Shringar House of Mangalsutra Ltd

Company Coordinates


