
Compare D.P. Abhushan with Similar Stocks
Dashboard
Strong ability to service debt as the company has a low Debt to EBITDA ratio of 0.95 times
Healthy long term growth as Net Sales has grown by an annual rate of 26.49% and Operating profit at 45.95%
With a growth in Net Profit of 76.96%, the company declared Very Positive results in Jun 26
With ROCE of 32.7, it has a Attractive valuation with a 3.8 Enterprise value to Capital Employed
Stock DNA
Gems, Jewellery And Watches
INR 3,194 Cr (Small Cap)
13.00
22
0.00%
0.42
37.92%
5.00
Total Returns (Price + Dividend) 
Latest dividend: 1 per share ex-dividend date: Sep-22-2023
Risk Adjusted Returns v/s
Returns Beta

News
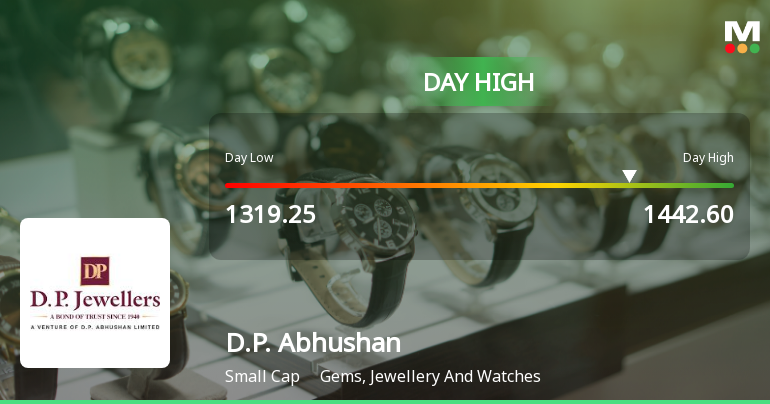
D.P. Abhushan Ltd Rallies 7.22% Surpassing All Major Moving Averages — Momentum Gains Strength
The Sensex advanced 0.78% on 27 Jul 2026, yet D.P. Abhushan Ltd outpaced the broader market with a robust 7.22% gain, closing near its intraday high of Rs 1442.6. This 6.61 percentage-point outperformance over its sector signals a distinctly stock-specific surge rather than a market-wide lift.
Read full news article
D.P. Abhushan Ltd is Rated Buy by MarketsMOJO
D.P. Abhushan Ltd is rated 'Buy' by MarketsMOJO, with this rating last updated on 10 July 2026. However, the analysis and financial metrics discussed here reflect the company’s current position as of 24 July 2026, providing investors with the most recent insights into its performance and outlook.
Read full news article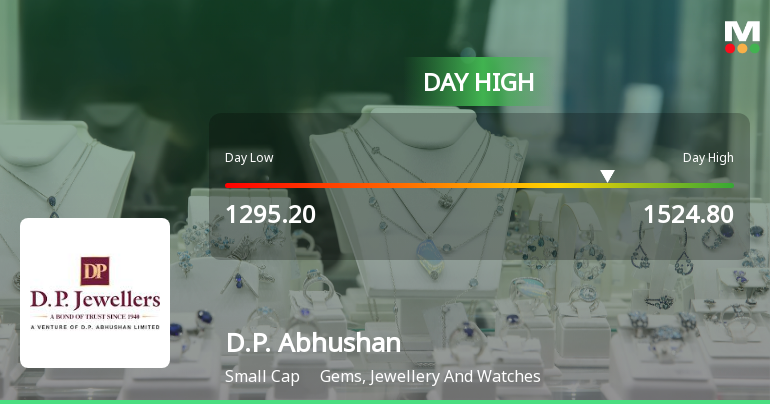
D.P. Abhushan Ltd Surges 8.83% to Day's High of Rs 1445.2 — Outperforms Sector by 5.24 Percentage Points
While the Sensex declined 0.77% on 20 Jul 2026, D.P. Abhushan Ltd surged 8.83%, marking a standout session in the Gems, Jewellery And Watches sector with a 5.24 percentage-point outperformance. This strong intraday performance rewrites the short-term narrative for the small-cap stock.
Read full news article Announcements
Announcement under Regulation 30 (LODR)-Analyst / Investor Meet - Outcome
22-Jul-2026 | Source : BSED. P. Abhushan Limited hereby submits Audio Recording Link of the Earnings Call held on July 22 2026.
Announcement under Regulation 30 (LODR)-Investor Presentation
21-Jul-2026 | Source : BSEWe hereby submit Investor Presentation for the Unaudited Financial Results of the company for quarter ended June 30 2026.
Announcement under Regulation 30 (LODR)-Press Release / Media Release
20-Jul-2026 | Source : BSEWe hereby submit Investor Press Release for the Quarter ended June 30 2026 titled D. P. Abhushan Limited commences FY27 with Strong Financial Momentum Delivering Revenue Growth of 58% and PAT Growth of 77% in Q1FY27
Corporate Actions

No Upcoming Board Meetings

D.P. Abhushan Ltd has declared 10% dividend, ex-date: 22 Sep 23

No Splits history available

No Bonus history available

No Rights history available
Quality key factors
Valuation key factors
Technicals key factors
 Technical Indicator Scale: Bearish, Mildly Bearish, Sideways, Mildly Bullish, Bullish Turned
 Shareholding Snapshot : Jun 2026
Shareholding Compare (%holding)
Promoters
None
Held by 0 Schemes
Held by 18 FIIs (0.23%)
Ratan Lal Kataria (29.46%)
Vijit Vijay Ramavat (2.93%)
19.08%
Quarterly Results Snapshot (Standalone) - Jun'26 - YoY

YoY Growth in quarter ended Jun 2026 is 57.74% vs 7.07% in Jun 2025
YoY Growth in quarter ended Jun 2026 is 76.96% vs 45.22% in Jun 2025
Half Yearly Results Snapshot (Standalone) - Sep'25

Growth in half year ended Sep 2025 is -0.09% vs 48.31% in Sep 2024
Growth in half year ended Sep 2025 is 75.02% vs 73.44% in Sep 2024
Nine Monthly Results Snapshot (Standalone) - Dec'25
YoY Growth in nine months ended Dec 2025 is 5.28% vs 45.45% in Dec 2024
YoY Growth in nine months ended Dec 2025 is 84.16% vs 91.74% in Dec 2024
Annual Results Snapshot (Standalone) - Mar'26
YoY Growth in year ended Mar 2026 is 22.78% vs 41.49% in Mar 2025
YoY Growth in year ended Mar 2026 is 87.97% vs 82.19% in Mar 2025
About D.P. Abhushan Ltd

Company Coordinates


