

Key Events This Week
13 Jul: Upgrade to Buy rating on strong financials and technical momentum
14 Jul: Technical momentum shifts amid mixed market signals
15 Jul: Intraday high surge of 13.53% to Rs.1,353.90
16 Jul: Technical momentum shift to mildly bullish with 11.32% gain
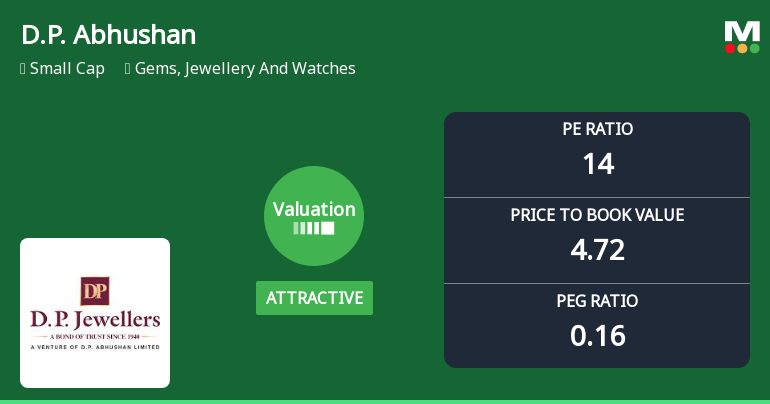
16 Jul: Valuation upgrade signals renewed price attractiveness
17 Jul: Week closes at Rs.1,334.25 (+0.59%)