
Compare GK Energy with Similar Stocks
Dashboard
High Management Efficiency with a high ROE of 0%
Strong ability to service debt as the company has a low Debt to EBITDA ratio of 0.67 times
Healthy long term growth as Net Sales has grown by an annual rate of 0% and Operating profit at 0%
Positive results in Mar 26
With ROE of 22.8, it has a Very Attractive valuation with a 3.1 Price to Book Value
Falling Participation by Institutional Investors
Stock DNA
Compressors, Pumps & Diesel Engines
INR 2,727 Cr (Small Cap)
14.00
34
0.00%
-0.27
22.75%
3.13
Total Returns (Price + Dividend) 
GK Energy for the last several years.
Risk Adjusted Returns v/s
Returns Beta

News
MarketsMOJO Downgrades GK Energy Ltd to Hold Amid Mixed Technical and Financial Signals
GK Energy Ltd, a small-cap player in the Compressors, Pumps & Diesel Engines sector, has seen its investment rating downgraded from Buy to Hold as of 23 July 2026. This adjustment reflects a nuanced shift across key evaluation parameters including technical trends, valuation metrics, financial performance, and overall quality scores, signalling a more cautious stance for investors amid evolving market dynamics.
Read full news article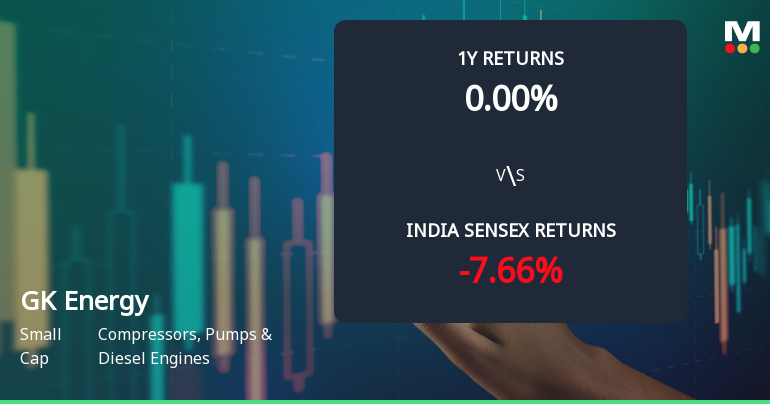
GK Energy Ltd Technical Momentum Shifts Amid Market Pressure
GK Energy Ltd, a small-cap player in the Compressors, Pumps & Diesel Engines sector, has experienced a notable shift in its technical momentum, moving from a mildly bullish stance to a sideways trend. This transition is reflected across key technical indicators such as MACD, RSI, moving averages, and volume-based metrics, signalling a period of consolidation after recent volatility.
Read full news article
GK Energy Ltd is Rated Buy
GK Energy Ltd is rated Buy by MarketsMOJO, with this rating last updated on 07 July 2026. However, the analysis and financial metrics discussed here reflect the stock's current position as of 19 July 2026, providing investors with the most up-to-date view of the company’s fundamentals, returns, and market standing.
Read full news article Announcements
Compliances-Certificate under Reg. 74 (5) of SEBI (DP) Regulations 2018
08-Jul-2026 | Source : BSEGK Energy Limited has informed the Exchange about Certificate under SEBI (Depositories and Participants) Regulations 2018 for the quarter ended June 2026.
Announcement under Regulation 30 (LODR)-Press Release / Media Release
06-Jul-2026 | Source : BSEGK Energy Limited has informed the Exchange regarding a press release dated July 06 2026 titled GK Energy Secures Rs. 235.92 Crore Order to Deploy 10000 Solar-Powered Water Pumping Systems Across Maharashtra.
Announcement under Regulation 30 (LODR)-Award_of_Order_Receipt_of_Order
05-Jul-2026 | Source : BSEGK Energy Limited has informed the exchange that the Company has received a letter of empanelment from Maharashtra State Electricity Distribution Company Limited for 10000 Off-Grid Solar Photovoltaic Water Pumping Systems (SPWPS) pumps under Magel Tyala Saur Krushi Pump Yojana. The total value of order is Rs. 235.92 Crores (inclusive of GST).
Corporate Actions

No Upcoming Board Meetings

No Dividend history available

No Splits history available

No Bonus history available

No Rights history available
Quality key factors
Valuation key factors
Technicals key factors
 Technical Indicator Scale: Bearish, Mildly Bearish, Sideways, Mildly Bullish, Bullish Turned
 Shareholding Snapshot : Jun 2026
Shareholding Compare (%holding)
Promoters
None
Held by 4 Schemes (3.39%)
Held by 8 FIIs (1.3%)
Gopal Rajaram Kabra (76.17%)
Vq Fastercap Fund Ii (1.88%)
9.46%
Quarterly Results Snapshot (Standalone) - Mar'26 - QoQ

QoQ Growth in quarter ended Mar 2026 is -9.05% vs 28.37% in Dec 2025
QoQ Growth in quarter ended Mar 2026 is 0.37% vs 26.63% in Dec 2025
Half Yearly Results Snapshot (Standalone) - Sep'25
Not Applicable: The company has declared_date for only one period
Not Applicable: The company has declared_date for only one period
Nine Monthly Results Snapshot (Standalone) - Dec'25
Not Applicable: The company has declared_date for only one period
Not Applicable: The company has declared_date for only one period
Annual Results Snapshot (Standalone) - Mar'26
YoY Growth in year ended Mar 2026 is 39.98% vs 166.32% in Mar 2025
YoY Growth in year ended Mar 2026 is 51.08% vs 269.13% in Mar 2025
About GK Energy Ltd

Company Coordinates


