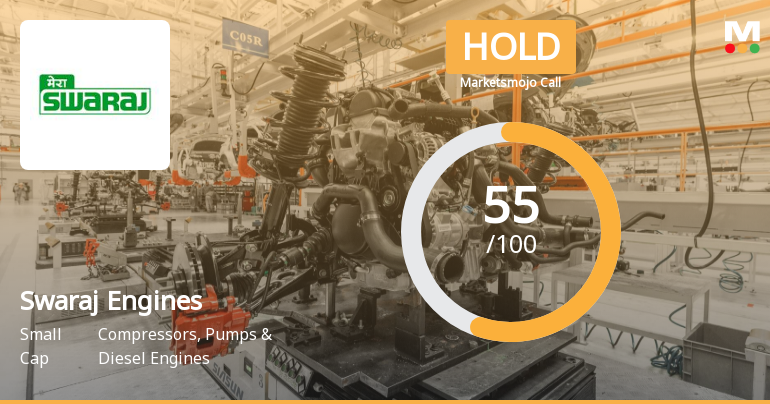
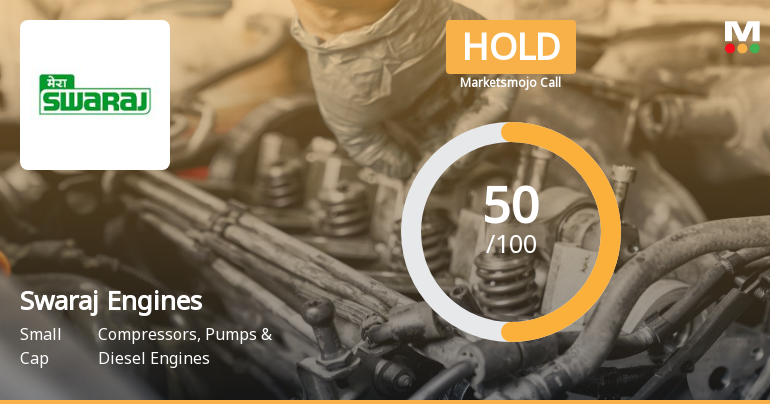
Swaraj Engines

  • Market Cap: Small Cap
  • Industry: Compressors, Pumps & Diesel Engines
  • ISIN: INE277A01016
  • NSEID: SWARAJENG
  • BSEID: 500407
INR
3,601.25
-20.4 (-0.56%)
BSENSE

Aug 07, 01:19 PM

BSE+NSE Vol: 3.07 k

  • Price Points
  • Score
  • Mojo Parameters
  • Total Return
  • News and Corporate Actions
  • Key factors
  • Shareholding
  • Financials
  • CompanyCV
stock-summaryPrice Point
High/Low

1Day

52 Week

Valuation
Technical
Day's Volume

CASH

3.07 k (-22.92%) Volume

Shareholding (Jun 2026)

FII

2.43%

Held by 69 FIIs

DII

8.78%

Held by 9 DIIs

Promoter

52.11%

Why is Swaraj Engines Ltd falling/rising?

06-Aug-2026

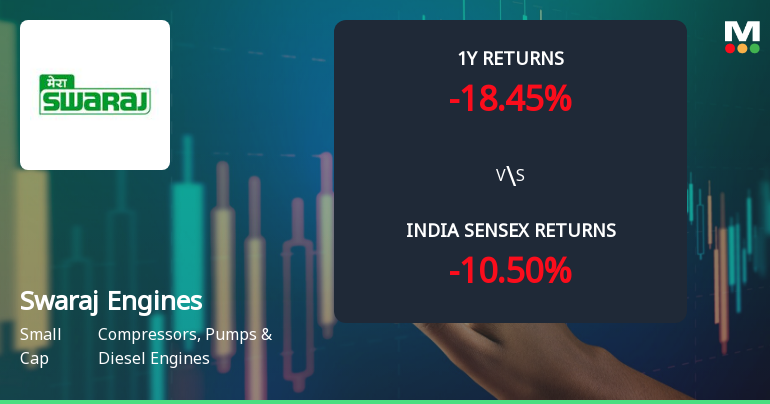
As of 06-Aug, Swaraj Engines Ltd's stock price is 3,621.65, showing a slight increase today but a mixed performance overall, with a 5.25% decline over the last month and a 7.71% drop over the past year. Despite strong management efficiency and positive quarterly results, the stock's underperformance against benchmarks and declining investor participation indicate a cautious outlook.

As of 06-Aug, Swaraj Engines Ltd's stock price is currently at 3,621.65, reflecting a slight increase of 8.95 (0.25%). Despite this small rise today, the stock has shown a mixed performance over various periods. Over the past week, it has remained unchanged, while it has decreased by 5.25% over the last month. Year-to-date, the stock has gained 0.96%, contrasting with a significant decline of 7.71% over the past year.<BR><BR>The stock's performance today indicates it has underperformed its sector by 0.61%, and it is trading below its moving averages across multiple time frames, including the 5-day, 20-day, 50-day, 100-day, and 200-day averages. Additionally, there has been a notable decline in investor participation, with delivery volume falling by 11.67% compared to the 5-day average.<BR><BR>On a positive note, Swaraj Engines Ltd has demonstrated high management efficiency with a return on equity (ROE) of 38.51% and is net-debt free. The company has reported positive results for the last three consecutive quarters, with net sales growing by 21.54% and a high dividend per share. However, despite these strengths, the stock has generated a negative return over the past year, which may contribute to investor caution.<BR><BR>Overall, while there is a slight rise in the stock price today, the broader context of underperformance against benchmarks, declining investor participation, and trading below moving averages suggests that the stock's outlook remains cautious.

View full answer

Should I buy, sell or hold Swaraj Engines Ltd?

28-Jul-2026

Are Swaraj Engines Ltd latest results good or bad?

20-Jul-2026

Swaraj Engines Ltd's latest results show strong revenue growth of 21.54% year-on-year, reaching ₹588.39 crores, but face challenges with declining operating margins and reduced cash flow, indicating potential headwinds for the company's near-term prospects.

Swaraj Engines Ltd's latest results present a mixed picture. On one hand, the company achieved a strong revenue growth of 21.54% year-on-year, reaching ₹588.39 crores in net sales, which is a record for the company. This growth is largely driven by robust demand from Mahindra & Mahindra's tractor business.<BR><BR>However, there are concerns regarding margin compression and cash flow. The operating margin has declined to 13.05%, down from 13.86% a year earlier, indicating rising input costs or competitive pressures that the company has not fully managed to offset. Additionally, while net profit increased by 11.13% to ₹55.53 crores, the profit margin has also slipped, suggesting that the pace of earnings growth is slowing relative to revenue.<BR><BR>Moreover, operating cash flow has significantly decreased, raising questions about the company's working capital management. This decline in cash flow, combined with the margin pressures, could pose challenges for the company's near-term prospects.<BR><BR>In summary, while Swaraj Engines has demonstrated strong top-line growth and maintains impressive return metrics, the margin compression and cash flow concerns indicate potential headwinds that investors should monitor closely.

View full answer

How big is Swaraj Engines?

11-Jun-2026

As of 10th June, Swaraj Engines Ltd has a market capitalization of 4,624.00 Cr, with recent net sales of 2007.13 Cr and a net profit of 196.31 Cr. The balance sheet for March 2025 shows shareholder's funds of 419.20 Cr and total assets of 668.97 Cr.

As of 10th June, Swaraj Engines Ltd has a market capitalization of 4,624.00 Cr, categorizing it as a Small Cap company.<BR><BR>In the latest four quarters, Swaraj Engines reported Net Sales of 2007.13 Cr and a Net Profit of 196.31 Cr.<BR><BR>The latest annual period for the balance sheet is March 2025, showing Shareholder's Funds of 419.20 Cr and Total Assets of 668.97 Cr.

View full answer

Who are in the management team of Swaraj Engines?

11-Jun-2026

The management team of Swaraj Engines includes Dileep C Choksi, Neera Saggi, Nagarajan Sivaramakrishnan, Nikhilesh Panchal (Independent Directors), Rajesh Jejurikar (Chairman), Rajesh Kumar Kapila (Company Secretary), Giju Kurian (Whole Time Director & CEO), Puneet Renjhen (Director), and Smita Mankad (Additional Director). They oversee the company's operations and strategic direction.

The management team of Swaraj Engines includes the following individuals:<BR><BR>1. **Dileep C Choksi** - Independent Director<BR>2. **Neera Saggi** - Independent Director<BR>3. **Rajesh Jejurikar** - Chairman (Non-Executive)<BR>4. **Rajesh Kumar Kapila** - Company Secretary & Compliance Officer<BR>5. **Nagarajan Sivaramakrishnan** - Independent Director<BR>6. **Nikhilesh Panchal** - Independent Director<BR>7. **Giju Kurian** - Whole Time Director & CEO<BR>8. **Puneet Renjhen** - Director<BR>9. **Smita Mankad** - Additional Director<BR><BR>This team plays a crucial role in overseeing the operations and strategic direction of the company.

View full answer

Who are the peers of the Swaraj Engines?

11-Jun-2026

Swaraj Engines' peers include Kirl. Brothers, Ingersoll-Rand, Kirl.Pneumatic, Shakti Pumps, Oswal Pumps, Greaves Cotton, Roto Pumps, and Yuken India, with varying management risks and growth rates. Kirl.Pneumatic leads in 1-year returns at 19.46%, while Swaraj Engines has a return of -6.89%.

Peers: The peers of Swaraj Engines are Kirl. Brothers, Ingersoll-Rand, Kirl.Pneumatic, Shakti Pumps, Oswal Pumps, Greaves Cotton, Roto Pumps, and Yuken India.<BR><BR>Quality Snapshot: Excellent management risk is observed at Ingersoll-Rand, while Good management risk is found at Kirl. Brothers, Kirl.Pneumatic, Shakti Pumps, Swaraj Engines, and Oswal Pumps, and the rest. Average management risk is present at Greaves Cotton, Roto Pumps, and Yuken India. Growth is Excellent at Oswal Pumps, Good at Ingersoll-Rand, Kirl.Pneumatic, Shakti Pumps, and Greaves Cotton, while Swaraj Engines and Roto Pumps show Below Average growth, and the rest. Capital Structure is Excellent for Kirl. Brothers, Ingersoll-Rand, Kirl.Pneumatic, Shakti Pumps, Swaraj Engines, Oswal Pumps, and Roto Pumps, while Good is noted for Greaves Cotton, and Average for Yuken India.<BR><BR>Return Snapshot: The peer with the highest 1-year return is Kirl.Pneumatic at 19.46%, while Shakti Pumps has the lowest at -47.02%. Swaraj Engines has a 1-year return of -6.89%, which is better than Shakti Pumps but worse than Kirl.Pneumatic. Additionally, Oswal Pumps, Greaves Cotton, Roto Pumps, and Yuken India have negative six-month returns.

View full answer

What does Swaraj Engines do?

10-Jun-2026

Swaraj Engines Ltd manufactures diesel engines primarily for "Swaraj" tractors and operates in the Compressors, Pumps & Diesel Engines industry. As of March 2026, it reported net sales of ₹546 Cr and a net profit of ₹55 Cr, with a market cap of ₹4,624 Cr.

Overview: <BR>Swaraj Engines Ltd is a small-cap company in the Compressors, Pumps & Diesel Engines industry, primarily manufacturing diesel engines for "Swaraj" tractors.<BR><BR>History: <BR>Swaraj Engines Ltd was incorporated in 1989-90 and has been operational since then. The latest quarterly results reported are for March 2026.<BR><BR>Financial Snapshot: <BR>Most recent Net Sales: 546 Cr (Quarterly Results - Mar 2026) <BR>Most recent Net Profit: 55 Cr (Quarterly Results - Mar 2026) <BR>Market-cap value: INR 4,624 Cr (Small Cap)<BR><BR>Key Metrics: <BR>P/E: 23.00 <BR>Industry P/E: 56 <BR>Dividend Yield: 2.77% <BR>Debt-Equity: -0.29 <BR>Return on Equity: 40.67% <BR>Price to Book: 9.39<BR><BR>Contact Details: <BR>Address: Phase IV Industrial area, SAS Nagar Mohali Punjab : 160055 <BR>Phone: 91-172-2271620-27 <BR>Email: selinvestor@swarajenterprise.com <BR>Website: http://www.swarajenterprise.com

View full answer

When is the next results date for Swaraj Engines Ltd?

02-Apr-2026

The next results date for Swaraj Engines Ltd is April 13, 2026.

The next results date for Swaraj Engines Ltd is scheduled for April 13, 2026.

View full answer

Is Swaraj Engines technically bullish or bearish?

29-Nov-2025

As of November 28, 2025, Swaraj Engines exhibits a neutral technical stance with mixed signals, showing a shift from mildly bullish to sideways, as various indicators present conflicting trends.

As of 28 November 2025, the technical trend for Swaraj Engines has changed from mildly bullish to sideways. The current technical stance is neutral, with mixed signals across different indicators. The MACD is mildly bearish on both weekly and monthly time frames, while the RSI shows no signal in both time frames. Bollinger Bands indicate a bearish stance weekly but mildly bullish monthly. Daily moving averages are mildly bullish, contrasting with the bearish signals from KST and Dow Theory on both weekly and monthly time frames. The OBV shows a bullish signal monthly but is mildly bearish weekly. Overall, the indicators suggest a lack of clear direction, resulting in a neutral stance.

View full answer

Is Swaraj Engines overvalued or undervalued?

17-Oct-2025

As of October 16, 2025, Swaraj Engines is fairly valued with a PE ratio of 28.33 and strong financial performance, including a ROCE of 91.46% and a YTD return of 39.56%, despite a recent short-term decline in stock performance.

As of 16 October 2025, Swaraj Engines has moved from expensive to fair in its valuation grade. The company is currently fairly valued, with a PE ratio of 28.33, an EV to EBITDA of 19.98, and a PEG ratio of 1.44. In comparison to its peers, Cummins India is deemed very expensive with a PE of 51.24, while Kirloskar Oil is rated attractive with a PE of 28.64.<BR><BR>Swaraj Engines exhibits strong financial performance, highlighted by a remarkable ROCE of 91.46% and an ROE of 42.23%. Despite recent stock performance showing a decline of 1.25% over the past week compared to a 1.58% gain in the Sensex, the company has outperformed the index significantly over the longer term, with a YTD return of 39.56% against the Sensex's 6.82%. This suggests that while the stock has faced short-term volatility, its overall valuation remains justified in the current market context.

View full answer

How has been the historical performance of Swaraj Engines?

16-Oct-2025

Swaraj Engines has shown consistent growth in net sales and profitability, with net sales increasing from INR 773.30 crore in March 2020 to INR 1,681.89 crore in March 2025, and profit after tax rising from INR 71.04 crore to INR 165.98 crore during the same period. The company's financial health is robust, reflected in improved earnings per share and cash flow from operations.

Answer:<BR>The historical performance of Swaraj Engines shows a consistent growth trend in net sales and profitability over the years.<BR><BR>Breakdown:<BR>Swaraj Engines has demonstrated significant growth in net sales, increasing from INR 773.30 crore in March 2020 to INR 1,681.89 crore in March 2025. This growth is reflected in total operating income, which rose from INR 871.74 crore in March 2019 to the same INR 1,681.89 crore in March 2025. The company's operating profit (PBDIT) also saw an upward trend, climbing from INR 113.21 crore in March 2020 to INR 243.72 crore in March 2025. Profit before tax increased from INR 93.07 crore in March 2020 to INR 223.05 crore in March 2025, while profit after tax rose from INR 71.04 crore to INR 165.98 crore in the same period. The earnings per share (EPS) improved significantly from INR 58.57 in March 2020 to INR 136.61 in March 2025. On the balance sheet, total assets grew from INR 355.04 crore in March 2020 to INR 668.97 crore in March 2025, with total liabilities also increasing from INR 355.04 crore to INR 668.97 crore. Cash flow from operating activities improved from INR 99 crore in March 2020 to INR 176 crore in March 2025, indicating a strong operational performance. Overall, Swaraj Engines has shown robust financial health and growth across various metrics over the years.

View full answer

Who are the top shareholders of the Swaraj Engines?

17-Jul-2025

The top shareholders of Swaraj Engines include Mahindra & Mahindra Limited with 52.12%, mutual funds holding 8.89%, foreign institutional investors at 3.48%, and individual investors at 28.11%, with DSP Small Cap Fund being the largest public shareholder at 6.42%.

The top shareholders of Swaraj Engines include Mahindra & Mahindra Limited, which holds the largest stake at 52.12%. Other significant shareholders are mutual funds, which collectively hold 8.89% through six different schemes, and foreign institutional investors (FIIs) with a combined holding of 3.48% across 82 FIIs. The highest public shareholder is DSP Small Cap Fund, owning 6.42%. Additionally, individual investors account for 28.11% of the shareholding.

View full answer

Has Swaraj Engines declared dividend?

06-Jun-2025

Yes, Swaraj Engines Ltd has declared a dividend of 1045%, amounting to ₹95 per share, with an ex-date of June 27, 2025. The company has shown strong total returns across various periods, with a 5-year total return of 233.05%.

Swaraj Engines Ltd has declared a dividend.<BR><BR>Dividend Details:<BR>- Percentage announced: 1045%<BR>- Amount per share: 95 per share<BR>- Ex-date: 27 Jun 25<BR><BR>Dividend Yield: 2.42%.<BR><BR>Total Returns by Period:<BR>In the last 6 months, Swaraj Engines Ltd achieved a price return of 21.12%, a dividend return of 3.19%, resulting in a total return of 24.31%.<BR><BR>Over the past year, the company experienced a price return of 60.79%, with a dividend return of 7.56%, leading to a total return of 68.35%.<BR><BR>In the 2-year period, Swaraj Engines Ltd saw a price return of 103.88% and a dividend return of 13.91%, culminating in a total return of 117.79%.<BR><BR>For the 3-year period, the price return was 144.46%, with a dividend return of 23.62%, achieving a total return of 168.08%.<BR><BR>In the last 4 years, the company recorded a price return of 155.33% and a dividend return of 20.50%, resulting in a total return of 175.83%.<BR><BR>Over the past 5 years, Swaraj Engines Ltd had a price return of 204.87% and a dividend return of 28.18%, leading to a total return of 233.05%.<BR><BR>Overall, Swaraj Engines Ltd has demonstrated strong performance with significant total returns across multiple periods, complemented by a substantial dividend declaration. The combination of high returns and dividends indicates a robust financial position.

View full answer
iScoreScore
Click here to find our call on this stock
Strong Sell
Sell
Hold
Buy
Strong Buy

Dashboard

1

High Management Efficiency with a high ROE of 38.51%

 
2

The company is Net-Debt Free

 
3

Poor long term growth as Net Sales has grown by an annual rate of 12.26% and Operating profit at 11.58% over the last 5 years

 
4

The company has declared Positive results for the last 3 consecutive quarters

5

With ROE of 41.8, it has a Attractive valuation with a 8.9 Price to Book Value

6

Falling Participation by Institutional Investors

7

Underperformed the market in the last 1 year

stock-summaryMojo Parameters

Mojo Parameters

Loading Valuation Snapshot...

Stock DNA

stock-summary
Industry

Compressors, Pumps & Diesel Engines

stock-summary
Market cap

INR 4,375 Cr (Small Cap)

stock-summary
P/E

21.00

stock-summary
Industry P/E

56

stock-summary
Dividend Yield

3.08%

stock-summary
Debt Equity

-0.29

stock-summary
Return on Equity

41.81%

stock-summary
Price to Book

8.88

Revenue and Profits:
Net Sales:
588 Cr
(Quarterly Results - Jun 2026)
Net Profit:
56 Cr
stock-summaryTotal Returns
Total Returns (Price + Dividend) stock-summary
Dividend Yield (3.08%)
TimePeriod
Price Return
Dividend Return
Total Return
3 Months
-9.79%
2.82%
-6.97%
6 Months
1.29%
3.07%
4.36%
1 Year
-8.82%
2.77%
-6.05%
2 Years
20.69%
7.08%
27.77%
3 Years
73.96%
15.22%
89.18%
4 Years
128.52%
25.30%
153.82%
5 Years
102.81%
29.08%
131.89%

Latest dividend: 110 per share ex-dividend date: Jul-03-2026

Risk Adjusted Returns v/s stock-summary
Returns Beta
Icon
Beta has not been calculated since enough price history is not available
stock-summaryNews & Corporate Actions

News

Announcements stock-summary

Shareholder Meeting / Postal Ballot-Scrutinizers Report

21-Jul-2026 | Source : BSE

Please refer enclosed file

Announcement under Regulation 30 (LODR)-Newspaper Publication

21-Jul-2026 | Source : BSE

Please refer enclosed file

Outcome Of The Board Meeting

20-Jul-2026 | Source : BSE

Please refer enclosed file

Corporate Actions stock-summary

stock-summary
BOARD MEETING

No Upcoming Board Meetings

stock-summary
DIVIDEND

Swaraj Engines Ltd has declared 1100% dividend, ex-date: 03 Jul 26

stock-summary
SPLITS

No Splits history available

stock-summary
BONUS

No Bonus history available

stock-summary
RIGHTS

No Rights history available

stock-summaryKey Factors

Quality key factors stock-summary

Factor
Value
Sales Growth (5y)
12.26%
EBIT Growth (5y)
11.58%
EBIT to Interest (avg)
100.00
Debt to EBITDA (avg)
Net Debt is too low
Net Debt to Equity (avg)
-0.29
Sales to Capital Employed (avg)
4.25
Tax Ratio
25.52%
Dividend Payout Ratio
68.08%
Pledged Shares
0
Institutional Holding
11.21%
ROCE (avg)
95.34%
ROE (avg)
38.51%

Valuation key factors

Factor
Value
P/E Ratio
21
Industry P/E
56
Price to Book Value
8.88
EV to EBIT
16.22
EV to EBITDA
14.92
EV to Capital Employed
12.06
EV to Sales
1.99
PEG Ratio
1.16
Dividend Yield
3.08%
ROCE (Latest)
71.66%
ROE (Latest)
41.81%

Technicals key factors

Indicator
Weekly
Monthly
MACD
Bearish
Mildly Bearish
RSI
No Signal
No Signal
Bollinger Bands
Bearish
Bearish
Moving Averages
Mildly Bullish (Daily)
KST
Mildly Bearish
Mildly Bearish
Dow Theory
Mildly Bearish
No Trend
OBV
Mildly Bearish
No Trend
stock-summary Technical Indicator Scale: Bearish, Mildly Bearish, Sideways, Mildly Bullish, Bullish  Turned 
stock-summaryShareholding
Shareholding Snapshot : Jun 2026stock-summary
Shareholding Compare (%holding) stock-summary
Majority shareholders

Promoters

Pledged Promoter Holdings

None

Mutual Funds

Held by 4 Schemes (7.78%)

FIIs

Held by 69 FIIs (2.43%)

Promoter with highest holding

Mahindra & Mahindra Limited (52.11%)

Highest Public shareholder

Dsp Small Cap Fund (6.02%)

Individual Investors Holdings

29.78%

stock-summaryFinancial
[
  {
    "link": "quarterly",
    "btn_text": "All Quarterly Results",
    "header": "Quarterly Results Snapshot (Standalone) - Jun'26 - YoY",
    "rhs": [
      {
        "prefix": "Net Sales ",
        "suffix": "YoY Growth in quarter ended Jun 2026 is 21.54% vs 15.82% in Jun 2025",
        "dir": 1
      },
      {
        "prefix": "Standalone Net Profit ",
        "suffix": "YoY Growth in quarter ended Jun 2026 is 11.13% vs 15.70% in Jun 2025",
        "dir": -1
      }
    ],
    "table": {
      "header": [
        "Jun'26",
        "Jun'25",
        "Change(%)"
      ],
      "body": [
        {
          "field": "Net Sales",
          "val1": "588.39",
          "val2": "484.10",
          "chgp": "21.54%",
          "chgp_class": "positive"
        },
        {
          "field": "Operating Profit (PBDIT) excl Other Income",
          "val1": "76.76",
          "val2": "67.10",
          "chgp": "14.40%",
          "chgp_class": "positive"
        },
        {
          "field": "Interest",
          "val1": "0.09",
          "val2": "0.10",
          "chgp": "-10.00%",
          "chgp_class": "positive"
        },
        {
          "field": "Exceptional Items",
          "val1": "0.00",
          "val2": "0.00",
          "chgp": "",
          "chgp_class": "neutral"
        },
        {
          "field": "Standalone Net Profit",
          "val1": "55.53",
          "val2": "49.97",
          "chgp": "11.13%",
          "chgp_class": "positive"
        },
        {
          "field": "Operating Profit Margin (Excl OI)",
          "val1": "13.05%",
          "val2": "13.86%",
          "chgp": "-0.81%",
          "chgp_class": "negative"
        }
      ]
    }
  },
  {
    "link": "half-yearly",
    "btn_text": "All Half Yearly Results",
    "header": "Half Yearly Results Snapshot (Standalone) - Sep'25",
    "rhs": [
      {
        "prefix": "Net Sales ",
        "suffix": " Growth in half year ended Sep 2025 is 12.00% vs 11.85% in Sep 2024",
        "dir": 1
      },
      {
        "prefix": "Standalone Net Profit ",
        "suffix": " Growth in half year ended Sep 2025 is 12.46% vs 12.75% in Sep 2024",
        "dir": -1
      }
    ],
    "table": {
      "header": [
        "Sep'25",
        "Sep'24",
        "Change(%)"
      ],
      "body": [
        {
          "field": "Net Sales",
          "val1": "988.14",
          "val2": "882.23",
          "chgp": "12.00%",
          "chgp_class": "positive"
        },
        {
          "field": "Operating Profit (PBDIT) excl Other Income",
          "val1": "135.13",
          "val2": "121.08",
          "chgp": "11.60%",
          "chgp_class": "positive"
        },
        {
          "field": "Interest",
          "val1": "0.20",
          "val2": "0.15",
          "chgp": "33.33%",
          "chgp_class": "negative"
        },
        {
          "field": "Exceptional Items",
          "val1": "0.00",
          "val2": "0.00",
          "chgp": "",
          "chgp_class": "neutral"
        },
        {
          "field": "Standalone Net Profit",
          "val1": "99.65",
          "val2": "88.61",
          "chgp": "12.46%",
          "chgp_class": "positive"
        },
        {
          "field": "Operating Profit Margin (Excl OI)",
          "val1": "13.68%",
          "val2": "13.72%",
          "chgp": "-0.04%",
          "chgp_class": "negative"
        }
      ]
    }
  },
  {
    "link": "nine-monthly",
    "btn_text": "All Nine Monthly Results",
    "header": "Nine Monthly Results Snapshot (Standalone) - Dec'25",
    "rhs": [
      {
        "prefix": "Net Sales ",
        "suffix": "YoY Growth in nine months ended Dec 2025 is 19.03% vs 14.93% in Dec 2024",
        "dir": 1
      },
      {
        "prefix": "Standalone Net Profit ",
        "suffix": "YoY Growth in nine months ended Dec 2025 is 17.58% vs 17.40% in Dec 2024",
        "dir": 1
      }
    ],
    "table": {
      "header": [
        "Dec'25",
        "Dec'24",
        "Change(%)"
      ],
      "body": [
        {
          "field": "Net Sales",
          "val1": "1,461.34",
          "val2": "1,227.73",
          "chgp": "19.03%",
          "chgp_class": "positive"
        },
        {
          "field": "Operating Profit (PBDIT) excl Other Income",
          "val1": "197.11",
          "val2": "165.37",
          "chgp": "19.19%",
          "chgp_class": "positive"
        },
        {
          "field": "Interest",
          "val1": "0.30",
          "val2": "0.25",
          "chgp": "20.00%",
          "chgp_class": "negative"
        },
        {
          "field": "Exceptional Items",
          "val1": "-3.40",
          "val2": "0.00",
          "chgp": "",
          "chgp_class": "neutral"
        },
        {
          "field": "Standalone Net Profit",
          "val1": "141.75",
          "val2": "120.56",
          "chgp": "17.58%",
          "chgp_class": "positive"
        },
        {
          "field": "Operating Profit Margin (Excl OI)",
          "val1": "13.49%",
          "val2": "13.47%",
          "chgp": "0.02%",
          "chgp_class": "positive"
        }
      ]
    }
  },
  {
    "link": "annual",
    "btn_text": "All Annual Results",
    "header": "Annual Results Snapshot (Standalone) - Mar'26",
    "rhs": [
      {
        "prefix": "Net Sales ",
        "suffix": "YoY Growth in year ended Mar 2026 is 19.34% vs 18.51% in Mar 2025",
        "dir": 1
      },
      {
        "prefix": "Standalone Net Profit ",
        "suffix": "YoY Growth in year ended Mar 2026 is 18.27% vs 20.39% in Mar 2025",
        "dir": -1
      }
    ],
    "table": {
      "header": [
        "Mar'26",
        "Mar'25",
        "Change(%)"
      ],
      "body": [
        {
          "field": "Net Sales",
          "val1": "2,007.13",
          "val2": "1,681.89",
          "chgp": "19.34%",
          "chgp_class": "positive"
        },
        {
          "field": "Operating Profit (PBDIT) excl Other Income",
          "val1": "272.12",
          "val2": "227.31",
          "chgp": "19.71%",
          "chgp_class": "positive"
        },
        {
          "field": "Interest",
          "val1": "0.39",
          "val2": "0.33",
          "chgp": "18.18%",
          "chgp_class": "negative"
        },
        {
          "field": "Exceptional Items",
          "val1": "-3.40",
          "val2": "0.00",
          "chgp": "",
          "chgp_class": "neutral"
        },
        {
          "field": "Standalone Net Profit",
          "val1": "196.31",
          "val2": "165.98",
          "chgp": "18.27%",
          "chgp_class": "positive"
        },
        {
          "field": "Operating Profit Margin (Excl OI)",
          "val1": "13.56%",
          "val2": "13.52%",
          "chgp": "0.04%",
          "chgp_class": "positive"
        }
      ]
    }
  }
]

Quarterly Results Snapshot (Standalone) - Jun'26 - YoYstock-summary

Jun'26
Jun'25
Change(%)
Net Sales
588.39
484.10
21.54%
Operating Profit (PBDIT) excl Other Income
76.76
67.10
14.40%
Interest
0.09
0.10
-10.00%
Exceptional Items
0.00
0.00
Standalone Net Profit
55.53
49.97
11.13%
Operating Profit Margin (Excl OI)
13.05%
13.86%
-0.81%
Values in Rs Cr.
Direction Arrows
Net Sales

YoY Growth in quarter ended Jun 2026 is 21.54% vs 15.82% in Jun 2025

Direction Arrows
Standalone Net Profit

YoY Growth in quarter ended Jun 2026 is 11.13% vs 15.70% in Jun 2025

Half Yearly Results Snapshot (Standalone) - Sep'25stock-summary

Sep'25
Sep'24
Change(%)
Net Sales
988.14
882.23
12.00%
Operating Profit (PBDIT) excl Other Income
135.13
121.08
11.60%
Interest
0.20
0.15
33.33%
Exceptional Items
0.00
0.00
Standalone Net Profit
99.65
88.61
12.46%
Operating Profit Margin (Excl OI)
13.68%
13.72%
-0.04%
Values in Rs Cr.
Direction Arrows
Net Sales

Growth in half year ended Sep 2025 is 12.00% vs 11.85% in Sep 2024

Direction Arrows
Standalone Net Profit

Growth in half year ended Sep 2025 is 12.46% vs 12.75% in Sep 2024

Nine Monthly Results Snapshot (Standalone) - Dec'25stock-summary

Dec'25
Dec'24
Change(%)
Net Sales
1,461.34
1,227.73
19.03%
Operating Profit (PBDIT) excl Other Income
197.11
165.37
19.19%
Interest
0.30
0.25
20.00%
Exceptional Items
-3.40
0.00
Standalone Net Profit
141.75
120.56
17.58%
Operating Profit Margin (Excl OI)
13.49%
13.47%
0.02%
Values in Rs Cr.
Direction Arrows
Net Sales

YoY Growth in nine months ended Dec 2025 is 19.03% vs 14.93% in Dec 2024

Direction Arrows
Standalone Net Profit

YoY Growth in nine months ended Dec 2025 is 17.58% vs 17.40% in Dec 2024

Annual Results Snapshot (Standalone) - Mar'26stock-summary

Mar'26
Mar'25
Change(%)
Net Sales
2,007.13
1,681.89
19.34%
Operating Profit (PBDIT) excl Other Income
272.12
227.31
19.71%
Interest
0.39
0.33
18.18%
Exceptional Items
-3.40
0.00
Standalone Net Profit
196.31
165.98
18.27%
Operating Profit Margin (Excl OI)
13.56%
13.52%
0.04%
Values in Rs Cr.
Direction Arrows
Net Sales

YoY Growth in year ended Mar 2026 is 19.34% vs 18.51% in Mar 2025

Direction Arrows
Standalone Net Profit

YoY Growth in year ended Mar 2026 is 18.27% vs 20.39% in Mar 2025

stock-summaryCompany CV
About Swaraj Engines Ltd stock-summary
stock-summary
Swaraj Engines Ltd
Small Cap
Compressors, Pumps & Diesel Engines
Swaraj Engines Limited (SEL) is primarily manufacturing diesel engines for fitment into "Swaraj" tractors being manufactured by Mahindra & Mahindra Ltd. (M&M). SEL is supplying diesel Engines in the range of 20 HP to 65 HP. Since the start of commercial operations in 1989-90, Company has supplied around 1.3 million engines for fitment into "Swaraj" tractors. Mahindra & Mahindra Limited (M&M) is the holding Company of the Company and holds 52.
Company Coordinates stock-summary
Company Details
Phase IV Industrial area, SAS Nagar Mohali Punjab : 160055
stock-summary
Tel: 91-172-2271620-27
stock-summary
selinvestor@swarajenterprise.com
Registrar Details
MCS Ltd , F-65, , Okhla Industrial Area, Phase - I, New Delhi