
Compare Greaves Cotton with Similar Stocks
Dashboard
The company is Net-Debt Free
Healthy long term growth as Operating profit has grown by an annual rate 46.56%
The company has declared Positive results for the last 5 consecutive quarters
With ROE of 8.1, it has a Fair valuation with a 3.5 Price to Book Value
Falling Participation by Institutional Investors
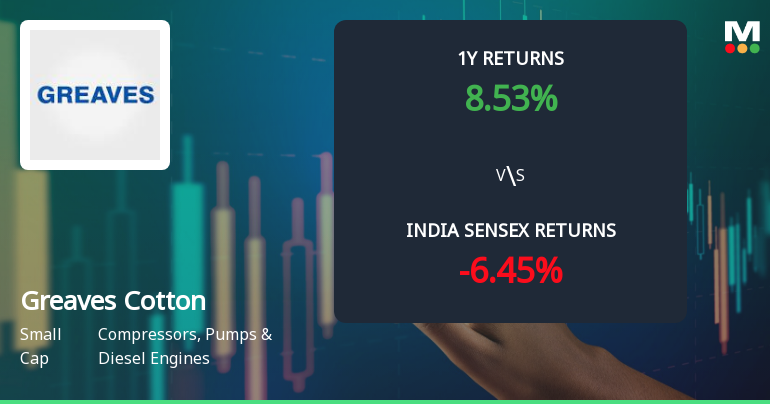
Market Beating performance in long term as well as near term
Stock DNA
Compressors, Pumps & Diesel Engines
INR 4,906 Cr (Small Cap)
43.00
60
0.97%
-0.16
8.11%
3.34
Total Returns (Price + Dividend) 
Latest dividend: 2 per share ex-dividend date: Jul-23-2025
Risk Adjusted Returns v/s
Returns Beta

News
Greaves Cotton Ltd. Exhibits Shift to Mildly Bullish Momentum Amid Technical Indicator Divergence
Greaves Cotton Ltd., a key player in the Compressors, Pumps & Diesel Engines sector, has witnessed a notable shift in its technical momentum, signalling a potential turnaround after a period of sideways movement. The stock’s recent 7.08% surge to ₹212.50, coupled with upgrades in technical indicators, has prompted a reassessment of its market stance, moving from a previous 'Sell' rating to a 'Hold' with a Mojo Score of 61.0 as of 19 June 2026.
Read full news article
Greaves Cotton Ltd. Surges 9.07% to Day's High of Rs 217 — Outperforms Sector by 7.99 Percentage Points
The Sensex advanced 0.63% on 22 Jun 2026, yet Greaves Cotton Ltd. outpaced the broader market with a robust 9.07% gain, reaching an intraday high of Rs 217. This 7.99 percentage-point outperformance over its sector underscores a distinctly stock-specific rally rather than a market-wide lift.
Read full news article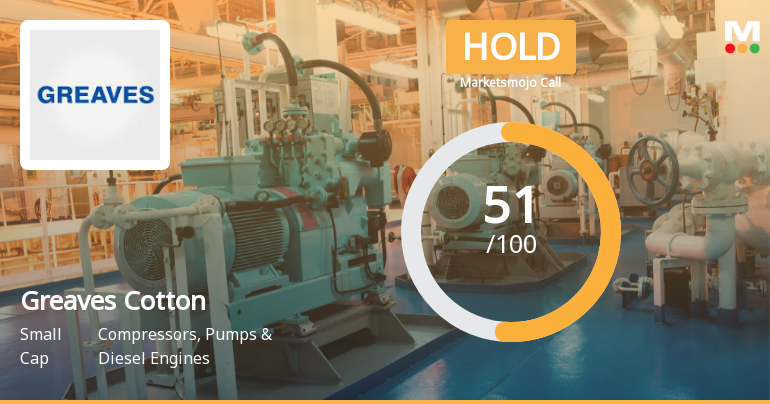
Greaves Cotton Ltd. Upgraded to Hold on Improved Technicals and Financial Trends
Greaves Cotton Ltd., a key player in the Compressors, Pumps & Diesel Engines sector, has seen its investment rating upgraded from Sell to Hold as of 19 June 2026. This shift reflects a nuanced improvement across multiple parameters including quality, valuation, financial trends, and technical indicators, signalling a cautious but optimistic outlook for investors.
Read full news article Announcements
Announcement under Regulation 30 (LODR)-Acquisition
23-Jun-2026 | Source : BSEPlease find attached herewith intimation regarding incorporation of a Wholly Owned Subsidiary
Communication To Shareholders - Intimation Regarding Deduction Of Tax At Source On Dividend
23-Jun-2026 | Source : BSEIn terms of Provisions of the Income Tax Act 2025 (the Act) dividend paid or distributed by the Company on or after 01st April 2020 is taxable in the hands of shareholders. Accordingly the Company is required to deduct tax at source at the prescribed rates on the dividend paid to shareholders. In this regard please find attached herewith an email communications which has been sent to all the shareholders of the Company whose email IDs are registered with the Company / Depositories explaining the process on withholding tax from dividends at prescribed rates. Please take the same on record.
Announcement under Regulation 30 (LODR)-Acquisition
23-Jun-2026 | Source : BSEPlease find attached herewith intimation regarding incorporation of a Wholly Owned Subsidiary
Corporate Actions

No Upcoming Board Meetings

Greaves Cotton Ltd. has declared 100% dividend, ex-date: 28 Jul 26

Greaves Cotton Ltd. has announced 2:10 stock split, ex-date: 24 Nov 10

No Bonus history available

No Rights history available
Quality key factors
Valuation key factors
Technicals key factors
 Technical Indicator Scale: Bearish, Mildly Bearish, Sideways, Mildly Bullish, Bullish Turned
 Shareholding Snapshot : Mar 2026
Shareholding Compare (%holding)
Promoters
None
Held by 7 Schemes (0.3%)
Held by 58 FIIs (1.85%)
Dbh Investment Capital India Private Limited (55.78%)
The New India Assurance Company Limited (2.01%)
32.61%
Quarterly Results Snapshot (Consolidated) - Mar'26 - QoQ

QoQ Growth in quarter ended Mar 2026 is 14.25% vs 7.36% in Dec 2025

QoQ Growth in quarter ended Mar 2026 is -11.61% vs -1.96% in Dec 2025
Half Yearly Results Snapshot (Consolidated) - Sep'25
Growth in half year ended Sep 2025 is 16.05% vs 3.84% in Sep 2024
Growth in half year ended Sep 2025 is 336.48% vs 106.91% in Sep 2024
Nine Monthly Results Snapshot (Consolidated) - Dec'25
YoY Growth in nine months ended Dec 2025 is 16.26% vs 6.88% in Dec 2024
YoY Growth in nine months ended Dec 2025 is 146.29% vs 124.92% in Dec 2024
Annual Results Snapshot (Consolidated) - Mar'26
YoY Growth in year ended Mar 2026 is 17.76% vs 10.83% in Mar 2025
YoY Growth in year ended Mar 2026 is 83.46% vs 143.17% in Mar 2025
About Greaves Cotton Ltd.

Company Coordinates


