
Compare Oswal Pumps with Similar Stocks
Dashboard
High Management Efficiency with a high ROCE of 53.89%
Strong ability to service debt as the company has a low Debt to EBITDA ratio of 0.18 times
Healthy long term growth as Net Sales has grown by an annual rate of 64.30% and Operating profit at 165.63%
The company has declared Positive results for the last 4 consecutive quarters
With ROE of 22.4, it has a Very Attractive valuation with a 2.7 Price to Book Value
Falling Participation by Institutional Investors
Below par performance in long term as well as near term
Stock DNA
Compressors, Pumps & Diesel Engines
INR 4,545 Cr (Small Cap)
12.00
35
0.00%
-0.09
22.41%
2.74
Total Returns (Price + Dividend) 
Oswal Pumps for the last several years.
Risk Adjusted Returns v/s
Returns Beta

News
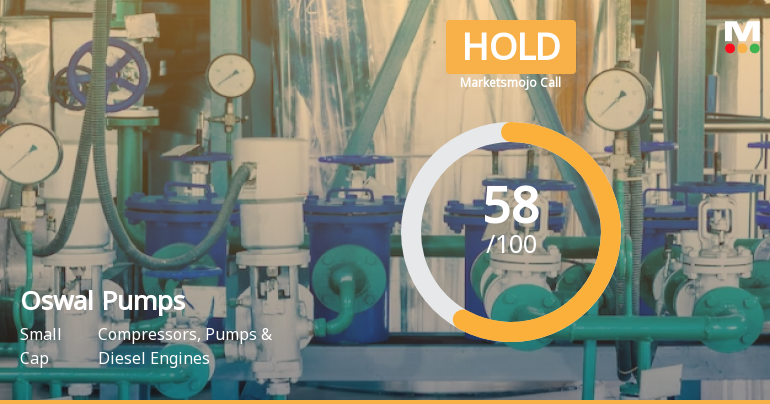
Oswal Pumps Ltd is Rated Hold
Oswal Pumps Ltd is rated 'Hold' by MarketsMOJO, with this rating last updated on 29 June 2026. However, the analysis and financial metrics discussed here reflect the stock's current position as of 13 July 2026, providing investors with an up-to-date view of the company’s fundamentals, returns, and market standing.
Read full news article
Oswal Pumps Ltd is Rated Hold by MarketsMOJO
Oswal Pumps Ltd is rated 'Hold' by MarketsMOJO, with this rating last updated on 29 June 2026. However, the analysis and financial metrics discussed here reflect the company’s current position as of 02 July 2026, providing investors with the most up-to-date insight into the stock’s fundamentals, valuation, financial trend, and technical outlook.
Read full news article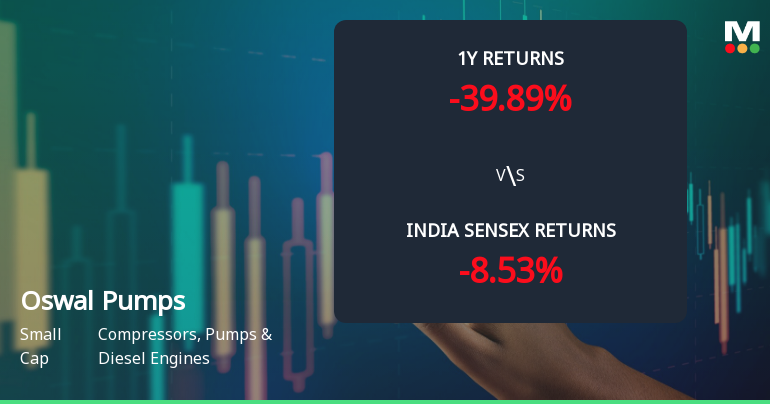
Oswal Pumps Ltd Technical Momentum Shifts Amid Mixed Market Signals
Oswal Pumps Ltd has experienced a notable shift in its technical momentum, moving from a sideways trend to a mildly bearish stance as of late June 2026. Despite a recent downgrade from a Buy to a Hold rating, the stock exhibits a complex interplay of technical indicators that suggest cautious optimism amid prevailing market headwinds.
Read full news article Announcements
Compliances-Certificate under Reg. 74 (5) of SEBI (DP) Regulations 2018
09-Jul-2026 | Source : BSEAs per attached intimation letter.
Announcement under Regulation 30 (LODR)-Award_of_Order_Receipt_of_Order
04-Jul-2026 | Source : BSEAs per attached intimation letter.
Announcement under Regulation 30 (LODR)-Press Release / Media Release
04-Jul-2026 | Source : BSEAs per attached intimation letter.
Corporate Actions

No Upcoming Board Meetings

No Dividend history available

No Splits history available

No Bonus history available

No Rights history available
Quality key factors
Valuation key factors
Technicals key factors
 Technical Indicator Scale: Bearish, Mildly Bearish, Sideways, Mildly Bullish, Bullish Turned
 Shareholding Snapshot : Mar 2026
Shareholding Compare (%holding)
Promoters
None
Held by 10 Schemes (4.49%)
Held by 11 FIIs (0.85%)
Shorya Trading Company Private Limited (47.84%)
Quant Mutual Fund - Quant Small Cap Fund (1.68%)
12.66%
Quarterly Results Snapshot (Consolidated) - Mar'26 - QoQ

QoQ Growth in quarter ended Mar 2026 is 1.73% vs -7.15% in Dec 2025
QoQ Growth in quarter ended Mar 2026 is 1.06% vs -6.09% in Dec 2025
Half Yearly Results Snapshot (Standalone) - Sep'25
Not Applicable: The company has declared_date for only one period
Not Applicable: The company has declared_date for only one period
Nine Monthly Results Snapshot (Standalone) - Dec'25
Not Applicable: The company has declared_date for only one period
Not Applicable: The company has declared_date for only one period
Annual Results Snapshot (Consolidated) - Mar'26

YoY Growth in year ended Mar 2026 is 44.33% vs 88.55% in Mar 2025
YoY Growth in year ended Mar 2026 is 34.09% vs 187.30% in Mar 2025
About Oswal Pumps Ltd

Company Coordinates


