Ganesh Consumer

  • Market Cap: Micro Cap
  • Industry: Other Agricultural Products
  • ISIN: INE652V01016
  • NSEID: GANESHCP
  • BSEID: 544528
INR
197.50
-0.55 (-0.28%)
BSENSE

Jul 02, 12:24 PM

BSE+NSE Vol: 17.74 k

  • Price Points
  • Score
  • Mojo Parameters
  • Total Return
  • News and Corporate Actions
  • Key factors
  • Shareholding
  • Financials
  • CompanyCV
stock-summaryPrice Point
High/Low

1Day

52 Week

Valuation
Technical
Day's Volume

CASH

17.74 k (-47.40%) Volume

Shareholding (Mar 2026)

FII

2.78%

Held by 10 FIIs

DII

5.63%

Held by 0 DIIs

Promoter

64.08%

Why is Ganesh Consumer Products Ltd falling/rising?

02-Jul-2026

As of 01-Jul, Ganesh Consumer Products Ltd's stock price is rising to Rs 198.05, reflecting a 3.39% increase after a trend reversal. This rise is supported by increased investor participation and positive performance in the FMCG sector, despite a year-to-date decline of 13.42%.

As of 01-Jul, Ganesh Consumer Products Ltd's stock price is rising, currently at Rs 198.05, reflecting an increase of Rs 6.5 or 3.39%. This upward movement follows a trend reversal after three consecutive days of decline. The stock has outperformed its sector by 1%, indicating positive momentum in comparison to the broader market. <BR><BR>Today's performance is further supported by the stock reaching an intraday high of Rs 198.75, which is a 3.76% increase. Additionally, there has been a notable rise in investor participation, with delivery volume increasing by 23.12% compared to the five-day average. This suggests growing interest from investors, contributing to the stock's upward trajectory.<BR><BR>Moreover, the overall FMCG sector has gained by 2.37%, which may also be positively influencing Ganesh Consumer Products Ltd's stock price. Despite the stock's year-to-date performance showing a decline of 13.42%, the company's strong financial metrics, such as a low Debt to EBITDA ratio of 2.64 times and a significant profit growth of 75.61% in the latest six months, provide a solid foundation for its current price increase.

View full answer

What does Ganesh Consumer do?

11-Jun-2026

Ganesh Consumer Products Ltd operates in the Other Agricultural Products industry as a Micro Cap company, reporting net sales of 218 Cr and a net profit of 10 Cr for the quarter ending March 2026. Key metrics include a P/E ratio of 19.00 and a market cap of INR 846 Cr.

Overview:<BR>Ganesh Consumer Products Ltd operates in the Other Agricultural Products industry and is categorized as a Micro Cap company.<BR><BR>History:<BR>The incorporation year is not specified, and there are no status changes reported. The latest quarter for which sales and profit are reported is March 2026.<BR><BR>Financial Snapshot:<BR>Most recent Net Sales: 218 Cr (Quarterly Results - Mar 2026) <BR>Most recent Net Profit: 10 Cr (Quarterly Results - Mar 2026) <BR>Market-cap value: INR 846 Cr (Micro Cap)<BR><BR>Key Metrics:<BR>P/E: 19.00 <BR>Industry P/E: 45 <BR>Dividend Yield: 1.19% <BR>Debt Equity: -0.01 <BR>Return on Equity: 11.51% <BR>Price to Book: 2.30 <BR><BR>Contact Details:<BR>Registrar Address: Not available. <BR>Phone: Not available. <BR>Email: Not available. <BR>Website: Not available.

View full answer

How big is Ganesh Consumer?

11-Jun-2026

As of 10th June, Ganesh Consumer Products Ltd has a market capitalization of 846.00 Cr, with recent net sales of 871.41 Cr and a net profit of 42.39 Cr. Shareholder's funds are valued at 226.84 Cr, and total assets amount to 340.22 Cr.

As of 10th June, Ganesh Consumer Products Ltd has a market capitalization of 846.00 Cr, categorizing it as a Micro Cap company.<BR><BR>In the latest four quarters, the company reported Net Sales of 871.41 Cr and a Net Profit of 42.39 Cr.<BR><BR>For the latest annual period ending March 2025, Shareholder's Funds were valued at 226.84 Cr, while Total Assets amounted to 340.22 Cr.

View full answer

Who are the peers of the Ganesh Consumer?

11-Jun-2026

Ganesh Consumer's peers include AVT Natural Prod, Krishival Foods, Bombay Super Hyb, Regaal Resources, Mangalam Global, Sukhjit Starch, Modi Naturals, and KN Agri Resource. Key highlights: Krishival Foods shows excellent management and growth, while Mangalam Global leads in 1-year returns at 25.92%, and Modi Naturals has the lowest at -31.49%.

Peers: The peers of Ganesh Consumer are AVT Natural Prod, Krishival Foods, Bombay Super Hyb, Regaal Resources, Mangalam Global, Sukhjit Starch, Modi Naturals, and KN Agri Resource.<BR><BR>Quality Snapshot: Excellent management risk is observed at Krishival Foods, while Average management risk is found at AVT Natural Prod, Bombay Super Hyb, Regaal Resources, Sukhjit Starch, and Modi Naturals, and the rest. Growth is Excellent at Krishival Foods, Regaal Resources, and Mangalam Global, while Average growth is noted at Bombay Super Hyb, Good growth at Modi Naturals, and Below Average growth at AVT Natural Prod, Sukhjit Starch, and KN Agri Resource. Capital Structure is Excellent at AVT Natural Prod, Good at KN Agri Resource, while Below Average is seen at Regaal Resources, Mangalam Global, and Modi Naturals, and Average at Bombay Super Hyb and Sukhjit Starch.<BR><BR>Return Snapshot: The peer with the highest 1-year return is Mangalam Global at 25.92%, while the lowest is Modi Naturals at -31.49%, with Ganesh Consumer's own 1-year return being N/A. Additionally, peers Sukhjit Starch and Modi Naturals have negative six-month returns.

View full answer

Are Ganesh Consumer Products Ltd latest results good or bad?

23-May-2026

Ganesh Consumer Products Ltd's latest results show a strong year-on-year net profit increase of 108.75% for Q4 FY26, but a sequential decline of 21.80% raises concerns. While annual performance is positive, the decline in operating margins and slight revenue drop indicate ongoing challenges.

Ganesh Consumer Products Ltd's latest results present a mixed picture. On one hand, the company reported a significant year-on-year increase in net profit for Q4 FY26, rising by 108.75% to ₹9.54 crores. This is a positive indicator of improved profitability compared to the same quarter last year. However, there was a notable sequential decline in net profit of 21.80% from the previous quarter, which raises concerns about the company's operational challenges.<BR><BR>In terms of revenue, net sales for Q4 FY26 were ₹218.04 crores, reflecting a slight decline of 0.94% year-on-year, although there was a positive growth of 2.97% compared to the previous quarter. This suggests some stabilization after a significant drop in sales in the prior quarter.<BR><BR>The operating margin also saw a decline, dropping to 8.02% from 10.80% in the previous quarter, indicating increased cost pressures that the company has been unable to fully manage despite the modest revenue growth. <BR><BR>Overall, while the annual performance shows improvement with a 12% increase in net sales and a 34.62% rise in net profit for FY26, the quarterly results highlight ongoing challenges, particularly with margin sustainability. Investors may view the results as a sign of progress on an annual basis, but the sequential declines and margin pressures could be concerning for future performance.

View full answer

Should I buy, sell or hold Ganesh Consumer Products Ltd?

23-May-2026

When is the next results date for Ganesh Consumer Products Ltd?

15-May-2026

The next results date for Ganesh Consumer Products Ltd is 22 May 2026.

The next results date for Ganesh Consumer Products Ltd is scheduled for 22 May 2026.

View full answer
iScoreScore
Click here to find our call on this stock
Strong Sell
Sell
Hold
Buy
Strong Buy

Dashboard

1

Strong ability to service debt as the company has a low Debt to EBITDA ratio of 2.64 times

 
2

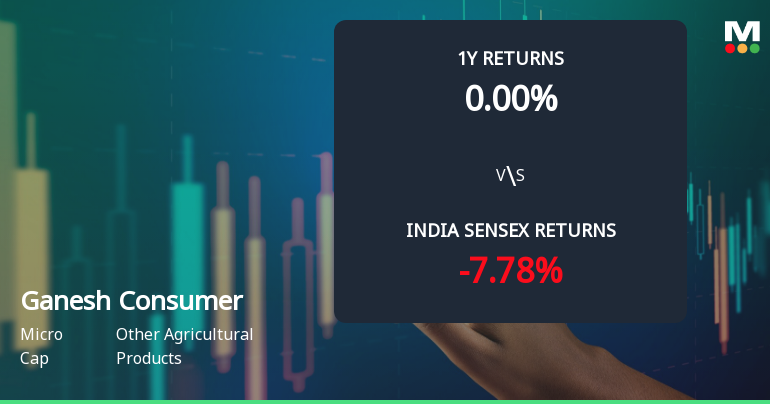
Poor long term growth as Net Sales has grown by an annual rate of 0% over the last 5 years

 
3

Positive results in Mar 26

4

With ROE of 11.5, it has a Very Attractive valuation with a 2.2 Price to Book Value

5

Falling Participation by Institutional Investors

stock-summaryMojo Parameters

Mojo Parameters

Loading Valuation Snapshot...

Stock DNA

stock-summary
Industry

Other Agricultural Products

stock-summary
Market cap

INR 798 Cr (Micro Cap)

stock-summary
P/E

19.00

stock-summary
Industry P/E

47

stock-summary
Dividend Yield

1.26%

stock-summary
Debt Equity

-0.01

stock-summary
Return on Equity

11.51%

stock-summary
Price to Book

2.17

Revenue and Profits:
Net Sales:
218 Cr
(Quarterly Results - Mar 2026)
Net Profit:
10 Cr
stock-summaryTotal Returns
Total Returns (Price + Dividend) stock-summary
Dividend Yield (1.26%)
TimePeriod
Price Return
Dividend Return
Total Return
3 Months
9.54%
0%
9.54%
6 Months
-12.32%
0%
-12.32%
1 Year
0%
0%
0.0%
2 Years
0%
0%
0.0%
3 Years
0%
0%
0.0%
4 Years
0%
0%
0.0%
5 Years
0%
0%
0.0%

Latest dividend: 2.493953006219765 per share ex-dividend date: Nov-14-2025

Risk Adjusted Returns v/s stock-summary
Returns Beta
Icon
Beta has not been calculated since enough price history is not available
stock-summaryNews & Corporate Actions

Announcements stock-summary

Disclosure Under Regulation 7(2) Of Securities And Exchange Board Of India (Prohibition Of Insider Trading) Regulations 2015

26-Jun-2026 | Source : BSE

Disclosure under regulation 7(2) of Securities and Exchange Board of India (Prohibition of Insider Trading) Regulations 2015

Closure of Trading Window

23-Jun-2026 | Source : BSE

Intimation of Closure of Trading Window under the SEBI (Prohibition of Insider Trading) Regulations 2015

Disclosure Under Regulation 7(2) Of Securities And Exchange Board Of India (Prohibition Of Insider Trading) Regulations2015

22-Jun-2026 | Source : BSE

Disclosure Under Regulation 7(2) of Securities and Exchange Board of India (Prohibition of Insider Trading) Regulation2015

Corporate Actions stock-summary

stock-summary
BOARD MEETING

No Upcoming Board Meetings

stock-summary
DIVIDEND

Ganesh Consumer Products Ltd has declared 25% dividend, ex-date: 14 Nov 25

stock-summary
SPLITS

No Splits history available

stock-summary
BONUS

No Bonus history available

stock-summary
RIGHTS

No Rights history available

stock-summaryKey Factors

Quality key factors stock-summary

Factor
Value
Sales Growth (5y)
0
EBIT Growth (5y)
0
EBIT to Interest (avg)
6.41
Debt to EBITDA (avg)
1.81
Net Debt to Equity (avg)
0
Sales to Capital Employed (avg)
2.18
Tax Ratio
25.40%
Dividend Payout Ratio
84.67%
Pledged Shares
0
Institutional Holding
8.41%
ROCE (avg)
15.13%
ROE (avg)
0

Valuation key factors

Factor
Value
P/E Ratio
19
Industry P/E
47
Price to Book Value
2.17
EV to EBIT
12.89
EV to EBITDA
9.31
EV to Capital Employed
2.18
EV to Sales
0.91
PEG Ratio
NA
Dividend Yield
1.26%
ROCE (Latest)
16.94%
ROE (Latest)
11.51%

Technicals key factors

Indicator
Weekly
Monthly
MACD
Mildly Bullish
RSI
No Signal
Bollinger Bands
Bullish
KST
Dow Theory
Mildly Bearish
No Trend
OBV
Mildly Bearish
No Trend
stock-summary Technical Indicator Scale: Bearish, Mildly Bearish, Sideways, Mildly Bullish, Bullish  Turned 
stock-summaryShareholding
Shareholding Snapshot : Mar 2026stock-summary
Shareholding Compare (%holding) stock-summary
Majority shareholders

Promoters

Pledged Promoter Holdings

None

Mutual Funds

Held by 0 Schemes

FIIs

Held by 10 FIIs (2.78%)

Promoter with highest holding

Srivaru Agro Private Limited (58.87%)

Highest Public shareholder

Subhkam Ventures I Pvt Ltd (3.42%)

Individual Investors Holdings

13.9%

stock-summaryFinancial
[
  {
    "link": "quarterly",
    "btn_text": "All Quarterly Results",
    "header": "Quarterly Results Snapshot (Standalone) - Mar'26 - QoQ",
    "rhs": [
      {
        "prefix": "Net Sales ",
        "suffix": "QoQ Growth in quarter ended Mar 2026 is 2.97% vs -11.28% in Dec 2025",
        "dir": 1
      },
      {
        "prefix": "Standalone Net Profit ",
        "suffix": "QoQ Growth in quarter ended Mar 2026 is -21.80% vs 9.71% in Dec 2025",
        "dir": -1
      }
    ],
    "table": {
      "header": [
        "Mar'26",
        "Dec'25",
        "Change(%)"
      ],
      "body": [
        {
          "field": "Net Sales",
          "val1": "218.04",
          "val2": "211.75",
          "chgp": "2.97%",
          "chgp_class": "positive"
        },
        {
          "field": "Operating Profit (PBDIT) excl Other Income",
          "val1": "17.49",
          "val2": "22.87",
          "chgp": "-23.52%",
          "chgp_class": "negative"
        },
        {
          "field": "Interest",
          "val1": "0.72",
          "val2": "1.65",
          "chgp": "-56.36%",
          "chgp_class": "positive"
        },
        {
          "field": "Exceptional Items",
          "val1": "0.00",
          "val2": "0.00",
          "chgp": "",
          "chgp_class": "neutral"
        },
        {
          "field": "Standalone Net Profit",
          "val1": "9.54",
          "val2": "12.20",
          "chgp": "-21.80%",
          "chgp_class": "negative"
        },
        {
          "field": "Operating Profit Margin (Excl OI)",
          "val1": "8.02%",
          "val2": "10.80%",
          "chgp": "-2.78%",
          "chgp_class": "negative"
        }
      ]
    }
  },
  {
    "link": "half-yearly",
    "btn_text": "All Half Yearly Results",
    "header": "Half Yearly Results Snapshot (Standalone) - Sep'25",
    "rhs": [
      {
        "prefix": "Net Sales ",
        "suffix": "Not Applicable: The company has declared_date for only one period",
        "dir": 0
      },
      {
        "prefix": "Standalone Net Profit ",
        "suffix": "Not Applicable: The company has declared_date for only one period",
        "dir": 0
      }
    ],
    "table": {
      "header": [
        "Sep'25",
        "Sep'24",
        "Change(%)"
      ],
      "body": [
        {
          "field": "Net Sales",
          "val1": "441.62",
          "val2": "412.20",
          "chgp": "7.14%",
          "chgp_class": "positive"
        },
        {
          "field": "Operating Profit (PBDIT) excl Other Income",
          "val1": "45.19",
          "val2": "43.47",
          "chgp": "3.96%",
          "chgp_class": "positive"
        },
        {
          "field": "Interest",
          "val1": "8.15",
          "val2": "3.39",
          "chgp": "140.41%",
          "chgp_class": "negative"
        },
        {
          "field": "Exceptional Items",
          "val1": "0.00",
          "val2": "0.00",
          "chgp": "",
          "chgp_class": "neutral"
        },
        {
          "field": "Standalone Net Profit",
          "val1": "20.65",
          "val2": "22.91",
          "chgp": "-9.86%",
          "chgp_class": "negative"
        },
        {
          "field": "Operating Profit Margin (Excl OI)",
          "val1": "10.23%",
          "val2": "10.55%",
          "chgp": "-0.32%",
          "chgp_class": "negative"
        }
      ]
    }
  },
  {
    "link": "nine-monthly",
    "btn_text": "All Nine Monthly Results",
    "header": "Nine Monthly Results Snapshot (Standalone) - Dec'25",
    "rhs": [
      {
        "prefix": "Net Sales ",
        "suffix": "Not Applicable: The company has declared_date for only one period",
        "dir": 0
      },
      {
        "prefix": "Standalone Net Profit ",
        "suffix": "Not Applicable: The company has declared_date for only one period",
        "dir": 0
      }
    ],
    "table": {
      "header": [
        "Dec'25",
        "Dec'24",
        "Change(%)"
      ],
      "body": [
        {
          "field": "Net Sales",
          "val1": "653.37",
          "val2": "630.36",
          "chgp": "3.65%",
          "chgp_class": "positive"
        },
        {
          "field": "Operating Profit (PBDIT) excl Other Income",
          "val1": "68.06",
          "val2": "60.24",
          "chgp": "12.98%",
          "chgp_class": "positive"
        },
        {
          "field": "Interest",
          "val1": "9.80",
          "val2": "4.57",
          "chgp": "114.44%",
          "chgp_class": "negative"
        },
        {
          "field": "Exceptional Items",
          "val1": "0.00",
          "val2": "0.00",
          "chgp": "",
          "chgp_class": "neutral"
        },
        {
          "field": "Standalone Net Profit",
          "val1": "32.85",
          "val2": "30.72",
          "chgp": "6.93%",
          "chgp_class": "positive"
        },
        {
          "field": "Operating Profit Margin (Excl OI)",
          "val1": "10.42%",
          "val2": "9.56%",
          "chgp": "0.86%",
          "chgp_class": "positive"
        }
      ]
    }
  },
  {
    "link": "annual",
    "btn_text": "All Annual Results",
    "header": "Annual Results Snapshot (Standalone) - Mar'26",
    "rhs": [
      {
        "prefix": "Net Sales ",
        "suffix": "YoY Growth in year ended Mar 2026 is 2.46% vs 12.04% in Mar 2025",
        "dir": -1
      },
      {
        "prefix": "Standalone Net Profit ",
        "suffix": "YoY Growth in year ended Mar 2026 is 19.64% vs 31.27% in Mar 2025",
        "dir": -1
      }
    ],
    "table": {
      "header": [
        "Mar'26",
        "Mar'25",
        "Change(%)"
      ],
      "body": [
        {
          "field": "Net Sales",
          "val1": "871.41",
          "val2": "850.46",
          "chgp": "2.46%",
          "chgp_class": "positive"
        },
        {
          "field": "Operating Profit (PBDIT) excl Other Income",
          "val1": "85.56",
          "val2": "73.24",
          "chgp": "16.82%",
          "chgp_class": "positive"
        },
        {
          "field": "Interest",
          "val1": "10.51",
          "val2": "6.39",
          "chgp": "64.48%",
          "chgp_class": "negative"
        },
        {
          "field": "Exceptional Items",
          "val1": "0.00",
          "val2": "0.00",
          "chgp": "",
          "chgp_class": "neutral"
        },
        {
          "field": "Standalone Net Profit",
          "val1": "42.39",
          "val2": "35.43",
          "chgp": "19.64%",
          "chgp_class": "positive"
        },
        {
          "field": "Operating Profit Margin (Excl OI)",
          "val1": "9.82%",
          "val2": "8.61%",
          "chgp": "1.21%",
          "chgp_class": "positive"
        }
      ]
    }
  }
]

Quarterly Results Snapshot (Standalone) - Mar'26 - QoQstock-summary

Mar'26
Dec'25
Change(%)
Net Sales
218.04
211.75
2.97%
Operating Profit (PBDIT) excl Other Income
17.49
22.87
-23.52%
Interest
0.72
1.65
-56.36%
Exceptional Items
0.00
0.00
Standalone Net Profit
9.54
12.20
-21.80%
Operating Profit Margin (Excl OI)
8.02%
10.80%
-2.78%
Values in Rs Cr.
Direction Arrows
Net Sales

QoQ Growth in quarter ended Mar 2026 is 2.97% vs -11.28% in Dec 2025

Direction Arrows
Standalone Net Profit

QoQ Growth in quarter ended Mar 2026 is -21.80% vs 9.71% in Dec 2025

Half Yearly Results Snapshot (Standalone) - Sep'25stock-summary

Sep'25
Sep'24
Change(%)
Net Sales
441.62
412.20
7.14%
Operating Profit (PBDIT) excl Other Income
45.19
43.47
3.96%
Interest
8.15
3.39
140.41%
Exceptional Items
0.00
0.00
Standalone Net Profit
20.65
22.91
-9.86%
Operating Profit Margin (Excl OI)
10.23%
10.55%
-0.32%
Values in Rs Cr.
Net Sales

Not Applicable: The company has declared_date for only one period

Standalone Net Profit

Not Applicable: The company has declared_date for only one period

Nine Monthly Results Snapshot (Standalone) - Dec'25stock-summary

Dec'25
Dec'24
Change(%)
Net Sales
653.37
630.36
3.65%
Operating Profit (PBDIT) excl Other Income
68.06
60.24
12.98%
Interest
9.80
4.57
114.44%
Exceptional Items
0.00
0.00
Standalone Net Profit
32.85
30.72
6.93%
Operating Profit Margin (Excl OI)
10.42%
9.56%
0.86%
Values in Rs Cr.
Net Sales

Not Applicable: The company has declared_date for only one period

Standalone Net Profit

Not Applicable: The company has declared_date for only one period

Annual Results Snapshot (Standalone) - Mar'26stock-summary

Mar'26
Mar'25
Change(%)
Net Sales
871.41
850.46
2.46%
Operating Profit (PBDIT) excl Other Income
85.56
73.24
16.82%
Interest
10.51
6.39
64.48%
Exceptional Items
0.00
0.00
Standalone Net Profit
42.39
35.43
19.64%
Operating Profit Margin (Excl OI)
9.82%
8.61%
1.21%
Values in Rs Cr.
Direction Arrows
Net Sales

YoY Growth in year ended Mar 2026 is 2.46% vs 12.04% in Mar 2025

Direction Arrows
Standalone Net Profit

YoY Growth in year ended Mar 2026 is 19.64% vs 31.27% in Mar 2025

stock-summaryCompany CV
About Ganesh Consumer Products Ltd stock-summary
stock-summary
Ganesh Consumer Products Ltd
Micro Cap
Other Agricultural Products
No Details Available.
Company Coordinates stock-summary
Icon
No Company Details Available