
Compare Ganesh Consumer with Similar Stocks
Dashboard
Strong ability to service debt as the company has a low Debt to EBITDA ratio of 2.64 times
Poor long term growth as Net Sales has grown by an annual rate of 0% over the last 5 years
Positive results in Mar 26
With ROE of 11.5, it has a Very Attractive valuation with a 2 Price to Book Value
Rising Promoter Confidence
Stock DNA
Other Agricultural Products
INR 729 Cr (Micro Cap)
17.00
46
1.38%
-0.01
11.51%
1.99
Total Returns (Price + Dividend) 
Latest dividend: 2.493953006219765 per share ex-dividend date: Nov-14-2025
Risk Adjusted Returns v/s
Returns Beta

News

Ganesh Consumer Products Ltd is Rated Hold
Ganesh Consumer Products Ltd is rated 'Hold' by MarketsMOJO, with this rating last updated on 27 April 2026. However, the analysis and financial metrics discussed here reflect the stock's current position as of 14 July 2026, providing investors with the most recent insights into the company’s performance and outlook.
Read full news article
Ganesh Consumer Products Ltd Technical Momentum Shifts to Mildly Bullish Amid Mixed Returns
Ganesh Consumer Products Ltd has experienced a subtle but notable shift in its technical momentum, moving from a sideways trend to a mildly bullish stance. Despite a recent downgrade in market sentiment reflected in its Mojo Grade upgrade from Sell to Hold, the stock’s technical indicators suggest cautious optimism amid a challenging market backdrop and underwhelming returns relative to the Sensex.
Read full news article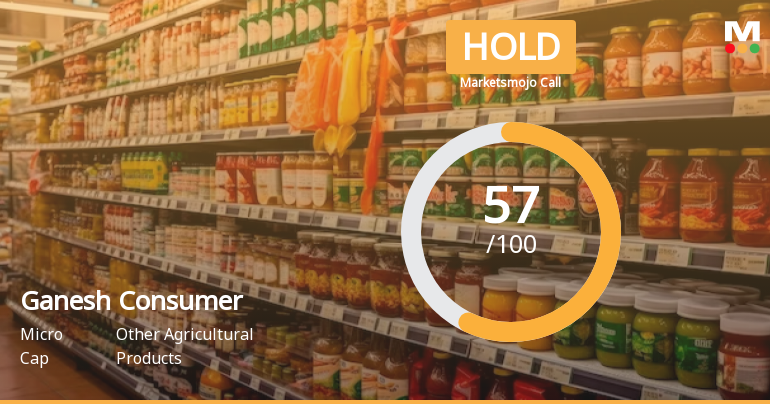
Ganesh Consumer Products Ltd is Rated Hold
Ganesh Consumer Products Ltd is rated 'Hold' by MarketsMOJO, with this rating last updated on 27 April 2026. However, the analysis and financial metrics discussed here reflect the stock's current position as of 03 July 2026, providing investors with an up-to-date perspective on the company’s fundamentals, valuation, financial trends, and technical outlook.
Read full news article Announcements
Compliances-Certificate under Reg. 74 (5) of SEBI (DP) Regulations 2018
06-Jul-2026 | Source : BSECertificate Under Regulation 74(5) of SEBI (DP) Regulations for the Quarter ended 30th June 2026
Disclosure Under Regulation 7(2) Of The Securities And Exchange Board Of India (Prohibition Of Insider Trading) Regulations 2015
03-Jul-2026 | Source : BSEDisclosure Under regulation 7(2) of the Securities and Exchange Board of India (Prohibition of Insider Trading) Regulations 2015
Disclosure Under Regulation 7(2) Of Securities And Exchange Board Of India (Prohibition Of Insider Trading) Regulations 2015
26-Jun-2026 | Source : BSEDisclosure under regulation 7(2) of Securities and Exchange Board of India (Prohibition of Insider Trading) Regulations 2015
Corporate Actions

No Upcoming Board Meetings

Ganesh Consumer Products Ltd has declared 25% dividend, ex-date: 14 Nov 25

No Splits history available

No Bonus history available

No Rights history available
Quality key factors
Valuation key factors
Technicals key factors
 Technical Indicator Scale: Bearish, Mildly Bearish, Sideways, Mildly Bullish, Bullish Turned
 Shareholding Snapshot : Jun 2026
Shareholding Compare (%holding)
Promoters
None
Held by 0 Schemes
Held by 9 FIIs (2.26%)
Srivaru Agro Private Limited (58.87%)
Subhkam Ventures (i) Private Limited (3.42%)
13.93%
Quarterly Results Snapshot (Standalone) - Mar'26 - QoQ

QoQ Growth in quarter ended Mar 2026 is 2.97% vs -11.28% in Dec 2025

QoQ Growth in quarter ended Mar 2026 is -21.80% vs 9.71% in Dec 2025
Half Yearly Results Snapshot (Standalone) - Sep'25
Not Applicable: The company has declared_date for only one period
Not Applicable: The company has declared_date for only one period
Nine Monthly Results Snapshot (Standalone) - Dec'25
Not Applicable: The company has declared_date for only one period
Not Applicable: The company has declared_date for only one period
Annual Results Snapshot (Standalone) - Mar'26
YoY Growth in year ended Mar 2026 is 2.46% vs 12.04% in Mar 2025
YoY Growth in year ended Mar 2026 is 19.64% vs 31.27% in Mar 2025
About Ganesh Consumer Products Ltd

Company Coordinates


