
Compare EPack PrefabTech with Similar Stocks
Dashboard
The company is Net-Debt Free
Healthy long term growth as Net Sales has grown by an annual rate of 0% and Operating profit at 0%
Positive results in Mar 26
With ROE of 12.6, it has a Attractive valuation with a 3.5 Price to Book Value
FIIs have decreased holdings this quarter and now hold 0.88% of the company
Stock DNA
Construction
INR 2,690 Cr (Small Cap)
28.00
24
0.00%
-0.26
12.59%
3.47
Total Returns (Price + Dividend) 
EPack PrefabTech for the last several years.
Risk Adjusted Returns v/s
Returns Beta

News
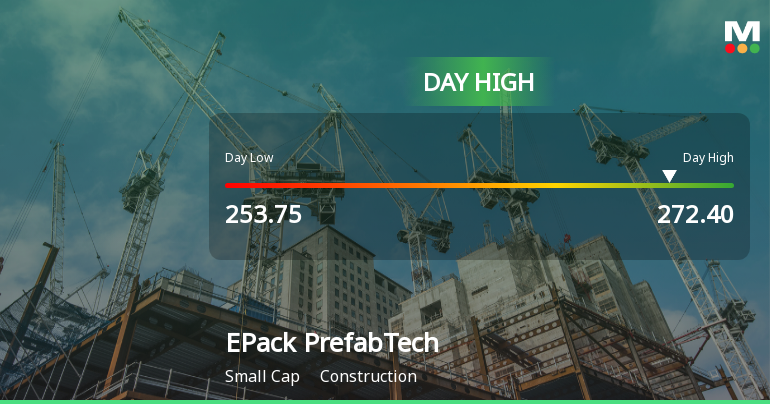
EPack Prefab Technologies Ltd Surges 7.23% to Day's High of Rs 271.75 — Outperforms Sector by 4.51 Percentage Points
The Sensex advanced 1.04% on 29 Jul 2026, yet EPack Prefab Technologies Ltd outpaced the broader market with a 7.23% gain, touching an intraday high of Rs 271.75. This 4.51 percentage-point outperformance over the Steel/Sponge Iron/Pig Iron sector’s 2.25% rise signals a distinctly stock-specific momentum shift rather than a mere market tailwind.
Read full news article
EPack Prefab Technologies Ltd Technical Momentum Shifts to Bullish Amid Construction Sector Recovery
EPack Prefab Technologies Ltd has demonstrated a notable shift in price momentum, transitioning from a mildly bullish to a bullish technical trend. This change is supported by a series of positive signals across key technical indicators including MACD, RSI, Bollinger Bands, and moving averages, signalling renewed investor confidence in the construction sector player.
Read full news article
EPack Prefab Technologies Ltd is Rated Buy
EPack Prefab Technologies Ltd is rated Buy by MarketsMOJO. This rating was last updated on 06 July 2026, reflecting a shift from the previous Hold status. However, the analysis and financial metrics discussed here represent the company’s current position as of 24 July 2026, providing investors with the latest insights into its performance and outlook.
Read full news article Announcements
Announcement under Regulation 30 (LODR)-Cessation
14-Jul-2026 | Source : BSEIntimation of resignation of SMP as per Regulation 30 of SEBI (Listing Obligations and Disclosure Requirements) Regulation 2015
Compliances-Certificate under Reg. 74 (5) of SEBI (DP) Regulations 2018
10-Jul-2026 | Source : BSECertificate under regulation 74(5) of SEBI (Depositories and Participants) Regulations 2018 for quarter ended June 30 2026.
Announcement under Regulation 30 (LODR)-Allotment of ESOP / ESPS
04-Jul-2026 | Source : BSEIntimation of ESOP Allotment of 2157 Equity Shares pursuant to exercise of stock options exercised under Companys EPACK Prefab Employee Stock Option Scheme 2024 (ESOP Scheme)
Corporate Actions

No Upcoming Board Meetings

No Dividend history available

No Splits history available

No Bonus history available

No Rights history available
Quality key factors
Valuation key factors
Technicals key factors
 Technical Indicator Scale: Bearish, Mildly Bearish, Sideways, Mildly Bullish, Bullish Turned
 Shareholding Snapshot : Jun 2026
Shareholding Compare (%holding)
Promoters
None
Held by 1 Schemes (1.36%)
Held by 8 FIIs (0.88%)
Rajjat Bothra (6.99%)
South Asia Growth Fund Iii Holdings, Llc (10.23%)
16.84%
Quarterly Results Snapshot (Standalone) - Mar'26 - QoQ

QoQ Growth in quarter ended Mar 2026 is 44.75% vs -25.05% in Dec 2025
QoQ Growth in quarter ended Mar 2026 is 79.98% vs -42.83% in Dec 2025
Half Yearly Results Snapshot (Standalone) - Sep'25
Not Applicable: The company has declared_date for only one period
Not Applicable: The company has declared_date for only one period
Nine Monthly Results Snapshot (Standalone) - Dec'25
Not Applicable: The company has declared_date for only one period
Not Applicable: The company has declared_date for only one period
Annual Results Snapshot (Standalone) - Mar'26
YoY Growth in year ended Mar 2026 is 34.52% vs 25.07% in Mar 2025
YoY Growth in year ended Mar 2026 is 56.42% vs 33.59% in Mar 2025
About EPack Prefab Technologies Ltd

Company Coordinates


