
Compare EPack PrefabTech with Similar Stocks
Stock DNA
Construction
INR 2,508 Cr (Small Cap)
27.00
26
0.00%
-0.26
12.59%
3.41
Total Returns (Price + Dividend) 
EPack PrefabTech for the last several years.
Risk Adjusted Returns v/s
Returns Beta

News
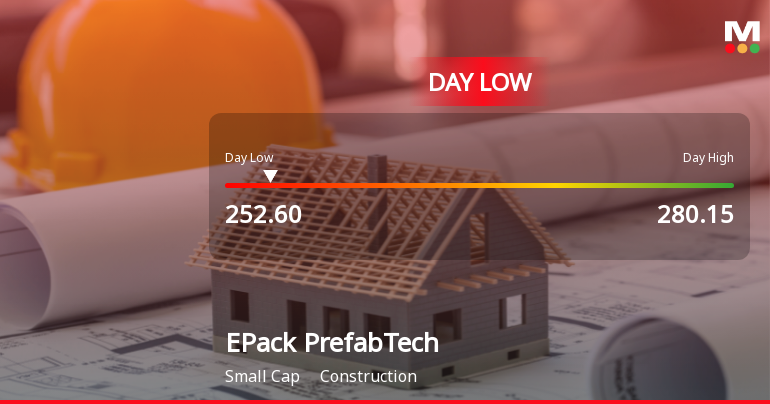
EPack Prefab Technologies Ltd Hits Intraday Low Amid Price Pressure
EPack Prefab Technologies Ltd experienced a significant intraday decline on 15 Jul 2026, touching a low of Rs 252.6, reflecting a sharp price correction amid broader market stability. The stock underperformed its sector and the Sensex, registering a day change of -7.72% and exhibiting heightened volatility throughout the session.
Read full news article
EPack Prefab Technologies Ltd is Rated Buy
EPack Prefab Technologies Ltd is rated Buy by MarketsMOJO, with this rating last updated on 06 July 2026. However, the analysis and financial metrics presented here reflect the company’s current position as of 13 July 2026, providing investors with the most up-to-date insight into its performance and outlook.
Read full news article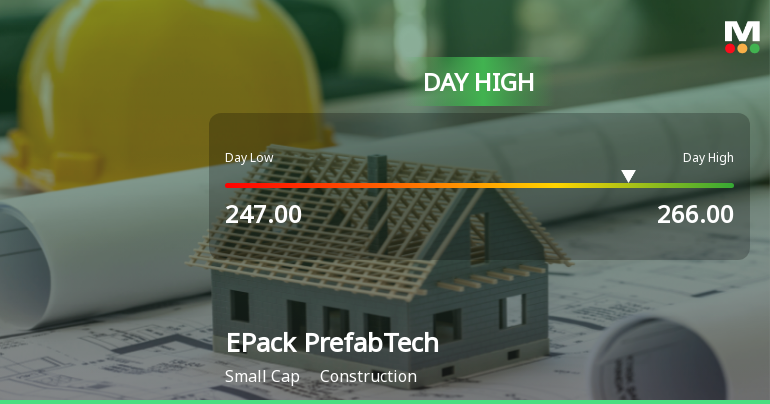
EPack Prefab Technologies Ltd Surges 7.97% to Day's High of Rs 262 — Outperforms Sector by 5.56 Percentage Points
The Sensex rose 0.58% on 09 Jul 2026, yet EPack Prefab Technologies Ltd outpaced the broader market with a 7.97% gain, touching an intraday high of Rs 262. This 5.56 percentage-point outperformance over its Construction sector peers signals a distinctly stock-specific rally rather than a mere market tailwind.
Read full news article Announcements
Announcement under Regulation 30 (LODR)-Cessation
14-Jul-2026 | Source : BSEIntimation of resignation of SMP as per Regulation 30 of SEBI (Listing Obligations and Disclosure Requirements) Regulation 2015
Compliances-Certificate under Reg. 74 (5) of SEBI (DP) Regulations 2018
10-Jul-2026 | Source : BSECertificate under regulation 74(5) of SEBI (Depositories and Participants) Regulations 2018 for quarter ended June 30 2026.
Announcement under Regulation 30 (LODR)-Allotment of ESOP / ESPS
04-Jul-2026 | Source : BSEIntimation of ESOP Allotment of 2157 Equity Shares pursuant to exercise of stock options exercised under Companys EPACK Prefab Employee Stock Option Scheme 2024 (ESOP Scheme)
Corporate Actions

No Upcoming Board Meetings

No Dividend history available

No Splits history available

No Bonus history available

No Rights history available
Quality key factors
Valuation key factors
Technicals key factors
 Technical Indicator Scale: Bearish, Mildly Bearish, Sideways, Mildly Bullish, Bullish Turned
 Shareholding Snapshot : Mar 2026
Shareholding Compare (%holding)
Promoters
None
Held by 1 Schemes (1.55%)
Held by 9 FIIs (10.91%)
Pinky Ajay Singhania (6.5%)
South Asia Growth Fund Iii Holdings, Llc (10.23%)
16.59%
Quarterly Results Snapshot (Standalone) - Mar'26 - QoQ

QoQ Growth in quarter ended Mar 2026 is 44.75% vs -25.05% in Dec 2025
QoQ Growth in quarter ended Mar 2026 is 79.98% vs -42.83% in Dec 2025
Half Yearly Results Snapshot (Standalone) - Sep'25
Not Applicable: The company has declared_date for only one period
Not Applicable: The company has declared_date for only one period
Nine Monthly Results Snapshot (Standalone) - Dec'25
Not Applicable: The company has declared_date for only one period
Not Applicable: The company has declared_date for only one period
Annual Results Snapshot (Standalone) - Mar'26
YoY Growth in year ended Mar 2026 is 34.52% vs 25.07% in Mar 2025
YoY Growth in year ended Mar 2026 is 56.42% vs 33.59% in Mar 2025
About EPack Prefab Technologies Ltd

Company Coordinates


