
Compare Aye Finance with Similar Stocks
Dashboard
Strong Long Term Fundamental Strength with a 0% CAGR growth in Net Sales
- PAT(Q) At Rs 85.91 cr has Grown at 131.5% (vs previous 4Q average)
- NET SALES(Q) At Rs 528.44 cr has Grown at 24.7% (vs previous 4Q average)
- PBDIT(Q) Highest at Rs 236.56 cr.
With ROE of 7.6, it has a Very Expensive valuation with a 1.7 Price to Book Value
High Institutional Holdings at 37.05%
Stock DNA
Non Banking Financial Company (NBFC)
INR 4,343 Cr (Small Cap)
22.00
21
0.00%
2.00
7.65%
1.72
Total Returns (Price + Dividend) 
Aye Finance for the last several years.
Risk Adjusted Returns v/s
Returns Beta

News
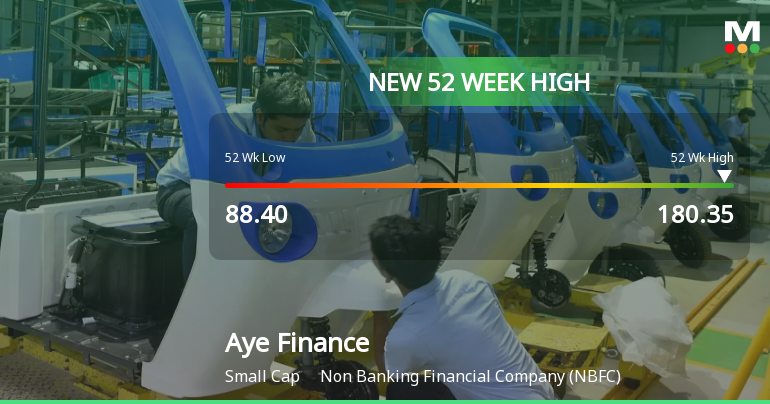
Broad-Based Technical Strength Lifts Aye Finance Ltd to 52-Week High of Rs 180.35
Surging to an all-time high of Rs 180.35 on 30 Jun 2026, Aye Finance Ltd has demonstrated remarkable price momentum, supported by a confluence of technical indicators signalling sustained strength across multiple timeframes.
Read full news article
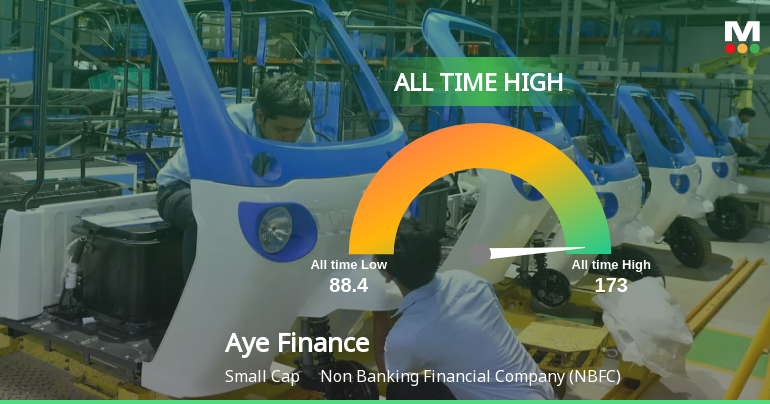
Aye Finance Ltd Hits All-Time High of Rs 174.10 as Momentum Builds Across Timeframes
Extending its winning streak to four sessions, Aye Finance Ltd surged 3.63% on 29 Jun 2026 to close at a fresh all-time high of Rs 174.10, just 0.64% above its previous 52-week peak. This rally comes amid sustained outperformance against the Sensex and the NBFC sector, signalling robust momentum across multiple timeframes.
Read full news article Announcements
Announcement under Regulation 30 (LODR)-Allotment
26-Jun-2026 | Source : BSEPursuant to Regulation 30 & 51 of SEBI (Listing Obligations & Disclosure Requirements) Regulations 2015 an intimation for allotment of Non-convertibles debentures amounting to INR 140 Crores is attached herewith
Announcement under Regulation 30 (LODR)-Press Release / Media Release
24-Jun-2026 | Source : BSEPursuant to Regulation 30 of SEBI (Listing Obligations & Disclosure Requirements) Regulations 2015 an intimation for Press Release is attached herewith
Announcement under Regulation 30 (LODR)-Credit Rating
24-Jun-2026 | Source : BSEPursuant to Regulations 30 & 51 of SEBI (Listing Obligations & Disclosure Requirements) Regulations 2015 an intimation for upgradation in Credit Rating of the Company is attached herewith
Corporate Actions

No Upcoming Board Meetings

No Dividend history available

No Splits history available

No Bonus history available

No Rights history available
Quality key factors
Valuation key factors
Technicals key factors
 Technical Indicator Scale: Bearish, Mildly Bearish, Sideways, Mildly Bullish, Bullish Turned
 Shareholding Snapshot : Mar 2026
Shareholding Compare (%holding)
Non Institution
None
Held by 2 Schemes (4.89%)
Held by 25 FIIs (18.66%)
None
Elevation Capital V Limited (12.59%)
4.37%
Quarterly Results Snapshot (Standalone) - Mar'26 - QoQ

QoQ Growth in quarter ended Mar 2026 is 19.35% vs 1.43% in Dec 2025
QoQ Growth in quarter ended Mar 2026 is 101.67% vs 23.37% in Dec 2025
Half Yearly Results Snapshot (Standalone) - Sep'25
Not Applicable: The company has declared_date for only one period
Not Applicable: The company has declared_date for only one period
Nine Monthly Results Snapshot (Standalone) - Dec'25
Not Applicable: The company has declared_date for only one period
Not Applicable: The company has declared_date for only one period
Annual Results Snapshot (Standalone) - Mar'26

YoY Growth in year ended Mar 2026 is 24.32% vs 40.33% in Mar 2025
YoY Growth in year ended Mar 2026 is 13.06% vs -0.24% in Mar 2025
About Aye Finance Ltd

Company Coordinates


