
Compare Grindwell Norton with Similar Stocks
Stock DNA
Industrial Products
INR 23,720 Cr (Small Cap)
56.00
63
0.79%
-0.43
16.38%
9.37
Total Returns (Price + Dividend) 
Latest dividend: 17 per share ex-dividend date: Jul-15-2025
Risk Adjusted Returns v/s
Returns Beta

News
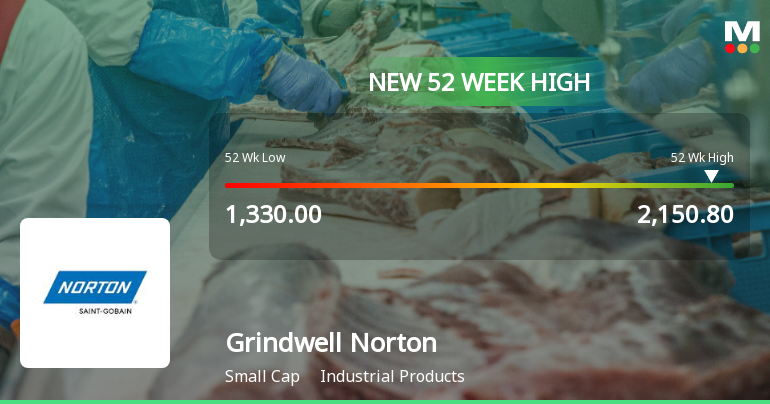
Broad-Based Technical Strength Lifts Grindwell Norton Ltd. to 52-Week High of Rs 2150.8
With every major technical indicator aligned to the upside, Grindwell Norton Ltd. surged to a fresh 52-week high of Rs 2150.8 on 22 Jun 2026, marking a significant milestone in its price momentum journey.
Read full news article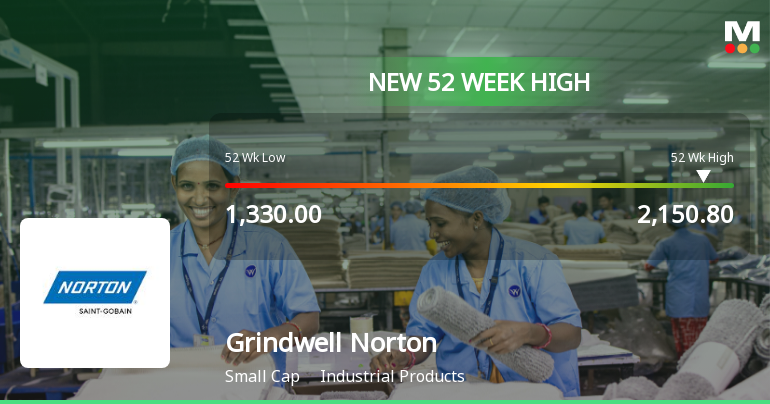
Broad-Based Technical Strength Lifts Grindwell Norton Ltd. to 52-Week High of Rs 2150.8
After a sustained six-day rally delivering nearly 12% returns, Grindwell Norton Ltd. surged to a fresh 52-week high of Rs 2150.8 on 19 Jun 2026, marking a significant milestone in its price momentum.
Read full news article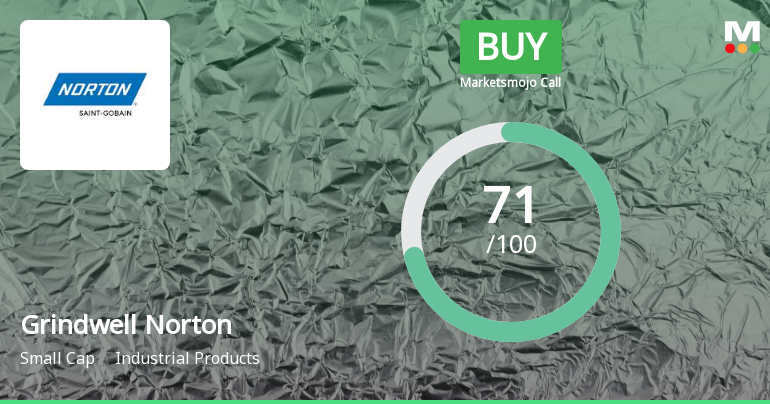
Grindwell Norton Ltd. is Rated Buy by MarketsMOJO
Grindwell Norton Ltd. is rated Buy by MarketsMOJO, with this rating last updated on 25 May 2026. While the rating change occurred on that date, the analysis and financial metrics discussed here reflect the company’s current position as of 19 June 2026, providing investors with the latest insights into the stock’s fundamentals, returns, and market performance.
Read full news article Announcements
Reminder To Shareholders Holding Shares In Physical Form To Update KYC Details And Dematerialise Their Shares
09-Jun-2026 | Source : BSEPlease find attached the intimation regarding reminder letter sent to holders of physical shares to update the KYC details and to dematerialise their shares
Announcement under Regulation 30 (LODR)-Investor Presentation
29-May-2026 | Source : BSEPlease find attached the Analyst/Investor Meeting Presentation.
Announcement under Regulation 30 (LODR)-Analyst / Investor Meet - Outcome
29-May-2026 | Source : BSEPlease find attached the intimation regarding the Analyst/Investor Meet Recording.
Corporate Actions

No Upcoming Board Meetings

Grindwell Norton Ltd. has declared 380% dividend, ex-date: 10 Jul 26

Grindwell Norton Ltd. has announced 5:10 stock split, ex-date: 26 May 06

Grindwell Norton Ltd. has announced 1:1 bonus issue, ex-date: 14 Jul 16

No Rights history available
Quality key factors
Valuation key factors
Technicals key factors
 Technical Indicator Scale: Bearish, Mildly Bearish, Sideways, Mildly Bullish, Bullish Turned
 Shareholding Snapshot : Mar 2026
Shareholding Compare (%holding)
Promoters
None
Held by 14 Schemes (17.74%)
Held by 124 FIIs (5.56%)
Saint Gobain Abrasives Inc (26.77%)
Sbi Midcap Fund (9.29%)
11.65%
Quarterly Results Snapshot (Consolidated) - Mar'26 - YoY

YoY Growth in quarter ended Mar 2026 is 18.70% vs 2.67% in Mar 2025
YoY Growth in quarter ended Mar 2026 is 28.31% vs -0.08% in Mar 2025
Half Yearly Results Snapshot (Consolidated) - Sep'25
Growth in half year ended Sep 2025 is 5.63% vs 4.77% in Sep 2024
Growth in half year ended Sep 2025 is 6.32% vs -4.78% in Sep 2024
Nine Monthly Results Snapshot (Consolidated) - Dec'25
YoY Growth in nine months ended Dec 2025 is 6.13% vs 5.33% in Dec 2024
YoY Growth in nine months ended Dec 2025 is 7.36% vs -5.10% in Dec 2024
Annual Results Snapshot (Consolidated) - Mar'26
YoY Growth in year ended Mar 2026 is 9.30% vs 4.65% in Mar 2025
YoY Growth in year ended Mar 2026 is 12.73% vs -3.89% in Mar 2025
About Grindwell Norton Ltd.

Company Coordinates


