
Compare Karur Vysya Bank with Similar Stocks
Dashboard
Strong Long Term Fundamental Strength with an average Return on Assets (ROA) of 2.55%
- Healthy long term growth as Net profit has grown by an annual rate of 49.89%
- The Bank has a high Capital Adequacy Ratio of 16.62% signifying high buffers against its risk based assets
The company has declared Positive results for the last 20 consecutive quarters
With ROA of 2, it has a Fair valuation with a 2.3 Price to Book Value
High Institutional Holdings at 59.15%
Company is among the highest 1% of companies rated by MarketsMojo across all 4,000 stocks
Total Returns (Price + Dividend) 
Latest dividend: 2.6 per share ex-dividend date: Jul-24-2026
Risk Adjusted Returns v/s
Returns Beta

News

Karur Vysya Bank Ltd. is Rated Strong Buy
Karur Vysya Bank Ltd. is rated Strong Buy by MarketsMOJO, with this rating last updated on 30 June 2026. However, the analysis and financial metrics discussed below reflect the stock’s current position as of 03 August 2026, providing investors with the latest insights into its performance and outlook.
Read full news article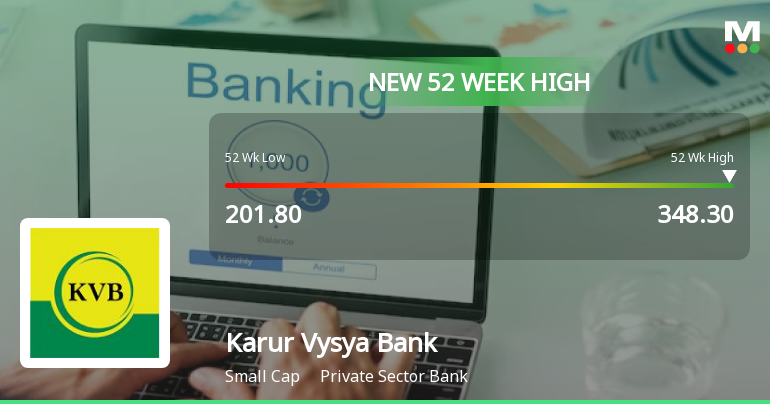
Broad-Based Technical Strength Lifts Karur Vysya Bank Ltd. to 52-Week High of Rs 350.1
With a decisive surge to Rs 350.1 on 3 Aug 2026, Karur Vysya Bank Ltd. has reached a fresh 52-week and all-time high, extending its impressive rally that has delivered over 60% returns in the past year. This milestone is underpinned by a strong alignment of technical indicators and sustained price momentum, setting the stock apart in a market where the Sensex has struggled to maintain its own gains.
Read full news article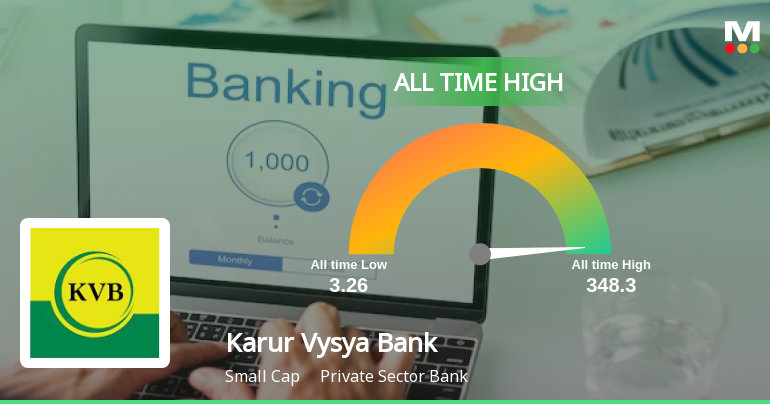
Announcements
Transcript of Conference Call
24-Jul-2026 | Source : BSEKarur Vysya Bank Ltd has submitted to BSE a copy of the Transcript of Conference Call held on July 20 2026 at 6:30 P.M. (IST) in connection with the unaudited Financial Results of the Bank for the quarter ended June 30 2026.
Intimation on charge taking by Shri Ravikumar Sadhana Chief General Manager - Head - Corporate & Commercial Banking
23-Jul-2026 | Source : BSEKarur Vysya Bank Ltd has informed BSE regarding Intimation on charge taking by Shri Ravikumar Sadhana Chief General Manager - Head - Corporate & Commercial Banking.
Audio Recording of the Conference Call
21-Jul-2026 | Source : BSEKarur Vysya Bank Ltd has informed BSE regarding Audio Recording of the Conference Call held with respects to the Unaudited Financial Results of the Bank for the quarter ended June 30 2026.
Corporate Actions

No Upcoming Board Meetings

Karur Vysya Bank Ltd. has declared 130% dividend, ex-date: 24 Jul 26

Karur Vysya Bank Ltd. has announced 2:10 stock split, ex-date: 17 Nov 16

Karur Vysya Bank Ltd. has announced 1:5 bonus issue, ex-date: 26 Aug 25

Karur Vysya Bank Ltd. has announced 1:6 rights issue, ex-date: 12 Oct 17
Quality key factors
Valuation key factors
Technicals key factors
 Technical Indicator Scale: Bearish, Mildly Bearish, Sideways, Mildly Bullish, Bullish Turned
 Shareholding Snapshot : Jun 2026
Shareholding Compare (%holding)
Non Institution
3.8527
Held by 41 Schemes (32.43%)
Held by 310 FIIs (17.92%)
Suriyanarayana A J (0.35%)
Hdfc Mutual Fund (various Funds) (0%)
35.11%
Quarterly Results Snapshot (Standalone) - Jun'26 - QoQ

QoQ Growth in quarter ended Jun 2026 is 5.02% vs 3.92% in Mar 2026

QoQ Growth in quarter ended Jun 2026 is 4.24% vs 5.07% in Mar 2026
Half Yearly Results Snapshot (Standalone) - Sep'25
Growth in half year ended Sep 2025 is 15.04% vs 20.45% in Sep 2024
Growth in half year ended Sep 2025 is 17.50% vs 26.48% in Sep 2024
Nine Monthly Results Snapshot (Standalone) - Dec'25
YoY Growth in nine months ended Dec 2025 is 14.08% vs 18.98% in Dec 2024
YoY Growth in nine months ended Dec 2025 is 25.00% vs 24.34% in Dec 2024
Annual Results Snapshot (Standalone) - Mar'26
YoY Growth in year ended Mar 2026 is 14.43% vs 17.84% in Mar 2025
YoY Growth in year ended Mar 2026 is 29.29% vs 20.99% in Mar 2025
About Karur Vysya Bank Ltd.

Company Coordinates


