
Compare Pilani Invest. with Similar Stocks
Dashboard
Weak Long Term Fundamental Strength with an average Return on Equity (ROE) of 1.19%
- Poor long term growth as Net Sales has grown by an annual rate of 7.32% and Operating profit at 5.90%
The company has declared Negative results for the last 6 consecutive quarters
Despite the size of the company, domestic mutual funds hold only 0% of the company
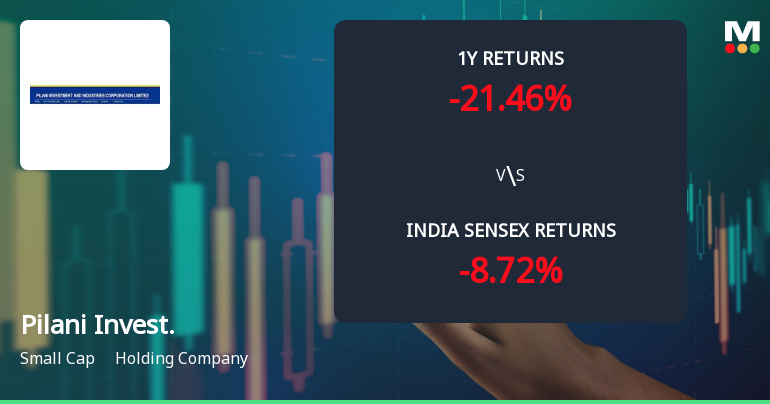
Underperformed the market in the last 1 year
Stock DNA
Holding Company
INR 4,803 Cr (Small Cap)
156.00
21
0.00%
0.15
0.20%
0.31
Total Returns (Price + Dividend) 
Latest dividend: 15 per share ex-dividend date: Sep-20-2024
Risk Adjusted Returns v/s
Returns Beta

News
Pilani Investment & Industries Corporation Ltd Faces Bearish Momentum Amid Technical Downturn
Pilani Investment & Industries Corporation Ltd, a small-cap holding company, has experienced a notable shift in its technical momentum, moving from a mildly bearish stance to a more pronounced bearish trend. Despite a strong long-term return profile, recent technical indicators signal caution for investors as the stock price struggles to maintain upward momentum amid broader market pressures.
Read full news article
Pilani Investment & Industries Corporation Ltd is Rated Strong Sell
Pilani Investment & Industries Corporation Ltd is rated Strong Sell by MarketsMOJO. This rating was last updated on 08 Jan 2026. However, the analysis and financial metrics presented here reflect the stock’s current position as of 25 June 2026, providing investors with an up-to-date view of the company’s fundamentals, returns, and market performance.
Read full news article
Pilani Investment & Industries Corporation Ltd: Technical Momentum Shifts Amid Bearish Sentiment
Pilani Investment & Industries Corporation Ltd has experienced a subtle shift in its technical momentum, moving from a firmly bearish stance to a mildly bearish outlook. Despite this slight improvement, key indicators continue to signal caution for investors as the stock trades near its 52-week lows, reflecting ongoing pressure in the holding company sector.
Read full news article Announcements
Closure of Trading Window
23-Jun-2026 | Source : BSEPlease refer the attached file.
Announcement under Regulation 30 (LODR)-Newspaper Publication
20-Jun-2026 | Source : BSEPlease refer the attached file.
Reg. 34 (1) Annual Report.
19-Jun-2026 | Source : BSEPlease refer the attached file.
Corporate Actions

No Upcoming Board Meetings

Pilani Investment & Industries Corporation Ltd has declared 90% dividend, ex-date: 06 Jul 26

No Splits history available

Pilani Investment & Industries Corporation Ltd has announced 2:5 bonus issue, ex-date: 31 Dec 20

No Rights history available
Quality key factors
Valuation key factors
Technicals key factors
 Technical Indicator Scale: Bearish, Mildly Bearish, Sideways, Mildly Bullish, Bullish Turned
 Shareholding Snapshot : Mar 2026
Shareholding Compare (%holding)
Promoters
None
Held by 1 Schemes (0.0%)
Held by 4 FIIs (0.43%)
Birla Group Holdings Private Limited (34.7%)
The Punjab Produce And Trading Co Pvt Ltd (17.52%)
11.37%
Quarterly Results Snapshot (Consolidated) - Mar'26 - YoY

YoY Growth in quarter ended Mar 2026 is -22.13% vs -10.49% in Mar 2025

YoY Growth in quarter ended Mar 2026 is 118.93% vs -179.80% in Mar 2025
Half Yearly Results Snapshot (Consolidated) - Sep'25
Growth in half year ended Sep 2025 is -2.94% vs 14.38% in Sep 2024
Growth in half year ended Sep 2025 is -63.08% vs 38.63% in Sep 2024
Nine Monthly Results Snapshot (Consolidated) - Dec'25
YoY Growth in nine months ended Dec 2025 is -2.75% vs 10.08% in Dec 2024
YoY Growth in nine months ended Dec 2025 is -78.72% vs -8.47% in Dec 2024
Annual Results Snapshot (Consolidated) - Mar'26
YoY Growth in year ended Mar 2026 is -6.38% vs 5.53% in Mar 2025
YoY Growth in year ended Mar 2026 is -68.46% vs -40.84% in Mar 2025
About Pilani Investment & Industries Corporation Ltd

Company Coordinates


