
Compare Man Industries with Similar Stocks
Stock DNA
Iron & Steel Products
INR 4,238 Cr (Small Cap)
24.00
25
0.00%
-0.05
8.17%
1.97
Total Returns (Price + Dividend) 
Latest dividend: 1.9924216327936615 per share ex-dividend date: Aug-14-2023
Risk Adjusted Returns v/s
Returns Beta

News
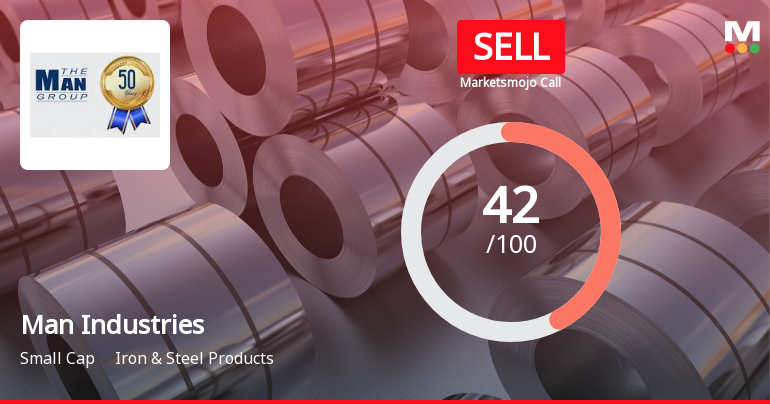
Man Industries (India) Ltd Downgraded to Sell Amid Mixed Financial and Technical Signals
Man Industries (India) Ltd has seen its investment rating downgraded from Hold to Sell, reflecting a complex interplay of deteriorating technical indicators, expensive valuation metrics, and subdued financial trends despite strong long-term returns. The company’s small-cap status and recent market performance have been overshadowed by concerns over profitability, institutional participation, and shifting technical momentum.
Read full news article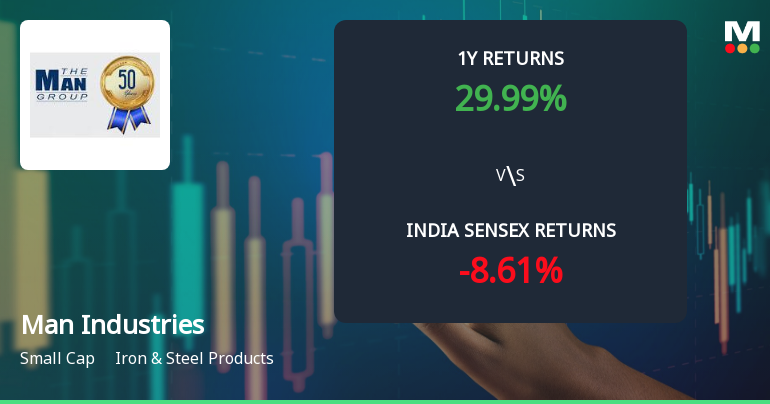
Man Industries (India) Ltd Sees Technical Momentum Shift Amid Mixed Market Signals
Man Industries (India) Ltd, a small-cap player in the Iron & Steel Products sector, has experienced a notable shift in its technical momentum, moving from a bullish to a mildly bullish stance. Despite a recent downgrade in its Mojo Grade from Hold to Sell, the stock’s technical indicators present a nuanced picture that investors should carefully analyse amid broader market dynamics.
Read full news article
Man Industries (India) Ltd is Rated Hold
Man Industries (India) Ltd is rated 'Hold' by MarketsMOJO, with this rating last updated on 10 Apr 2026. However, the analysis and financial metrics discussed here reflect the stock's current position as of 29 June 2026, providing investors with an up-to-date view of its fundamentals, returns, and market standing.
Read full news article Announcements
Announcement under Regulation 30 (LODR)-Analyst / Investor Meet - Intimation
07-Jul-2026 | Source : BSEAs per the attachment.
Announcement under Regulation 30 (LODR)-Analyst / Investor Meet - Intimation
06-Jul-2026 | Source : BSEAs per the attachment.
Announcement under Regulation 30 (LODR)-Analyst / Investor Meet - Intimation
04-Jul-2026 | Source : BSEAs per the attachment.
Corporate Actions

No Upcoming Board Meetings

Man Industries (India) Ltd has declared 40% dividend, ex-date: 14 Aug 23

Man Industries (India) Ltd has announced 5:10 stock split, ex-date: 09 Oct 07

No Bonus history available

No Rights history available
Quality key factors
Valuation key factors
Technicals key factors
 Technical Indicator Scale: Bearish, Mildly Bearish, Sideways, Mildly Bullish, Bullish Turned
 Shareholding Snapshot : Mar 2026
Shareholding Compare (%holding)
Non Institution
20.0543
Held by 1 Schemes (0.0%)
Held by 48 FIIs (2.41%)
Rameshchandra Mansukhani (15.0%)
Ashish Kacholia (3.04%)
34.01%
Quarterly Results Snapshot (Consolidated) - Mar'26 - QoQ

QoQ Growth in quarter ended Mar 2026 is 39.37% vs -0.44% in Dec 2025

QoQ Growth in quarter ended Mar 2026 is -7.61% vs 48.84% in Dec 2025
Half Yearly Results Snapshot (Consolidated) - Sep'25
Growth in half year ended Sep 2025 is 1.37% vs 3.77% in Sep 2024
Growth in half year ended Sep 2025 is 26.87% vs 0.95% in Sep 2024
Nine Monthly Results Snapshot (Consolidated) - Dec'25
YoY Growth in nine months ended Dec 2025 is 5.24% vs -1.91% in Dec 2024
YoY Growth in nine months ended Dec 2025 is 40.69% vs 4.94% in Dec 2024
Annual Results Snapshot (Consolidated) - Mar'26
YoY Growth in year ended Mar 2026 is 1.67% vs 11.56% in Mar 2025
YoY Growth in year ended Mar 2026 is 11.30% vs 45.68% in Mar 2025
About Man Industries (India) Ltd

Company Coordinates


